The Potential of Yangdorak Diagnosis Application of Gallstone
Article information

Abstract
Objectives
The aim of the study was to investigate the potential of Yangdorak diagnosis application against gallstone scanned by Ultrasound diagnosis.
Method
For this aim, among 97 patients who had visited Julip Korean Medicine Clinic from July 2016 to June 2023, 30 patients with no gallstone as a control group and 67 patients with gallstone and diagnosed by ultrasonography, were subjected to Yangdorak diagnosis. Then, the changes in Gallbladder Meridian (GB) value as F5 AVE(average of left and right GB value) by Yangdorak were comparatively analyzed between gallstone and non-gallstone groups and statistical significance was evaluated by Tukey’s multiple comparison test using Prism software.
Results
After all subjects were evaluated by the Yangdorak and ultrasonography to assess the potential of the Yangdorak diagnosis for gallstone, it was noteworthy that the Yangdorak values relevant to F5 AVE of female gallstone group(N=36) were significantly (p<0.001) decreased compared to the control group (N=30), while there was no significance in male gallstone group(N=31). Also, it was recognized significant difference between male and female groups.
Conclusion
Based on these results, if the Yangdorak value can be estimated from a decrease with clinical symptom in female patient, it is recommended to follow up the ultrasonography test for diagnosing the gallstone.
Large-sized Gallstone by Ultrasound. From left side, 1) 17.1mm, 2) 26.3mm, 3) 17.1mm, 4) Pyramidal stone
Medium size 8.78mm, Small-size 3.19mm Gallstone by Ultrasound
Gallbladder Meridian Deficiency(Left) and Gallbladder Meridian Excess(Right side)
F5 AVE Value of Control Group, Male Gallstone Group & Female Gallstone Group
Gallbladder Polyp by Ultrasound
Gallbladder Meridian Excess and Liver Meridian Excess at the Same Time

Comparison of Yangdorak Mean Value of Control Group & Gallstone Group
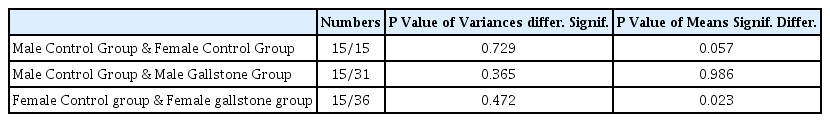
Comparison of Yangdorak Value of Male Control Group, Female Control Group, Male Gallstone Group & Female Gallstone Group
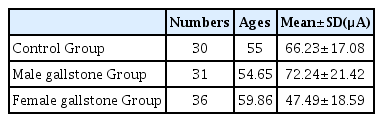
Yangdorak Value of Control Group, Male Gallstone Group & Female Gallstone Group
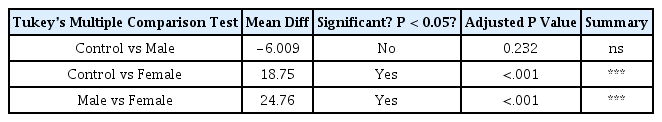
Tukey’s Multiple Comparison Test of F5 AVE Value among Control Group, Male Gallstone Group & Female Gallstone Group