Medical costs for patients with Facial paralysis : Based on Health Big Data
Article information
Abstract
Objectives:
The purpose of this study was to analyze the medical cost of facial paralysis in payer perspective and to estimate the practice pattern of patient using 2011 Health Insurance Review & Assessment Service-National Patients Sample(HIRA-NPS).
Methods:
Basic statistical system was used for descriptive analysis of NPS dataset. A table for general information (table20) was extracted by disease code, and social demographic characteristics, distribution of the use among inpatients and outpatients, utilization of each kind of medical care institutions, medical cost were analyzed. Subgroup analysis was conducted for assuming the practice pattern of korean medicine and western medicine.
Results:
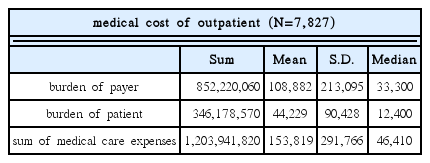
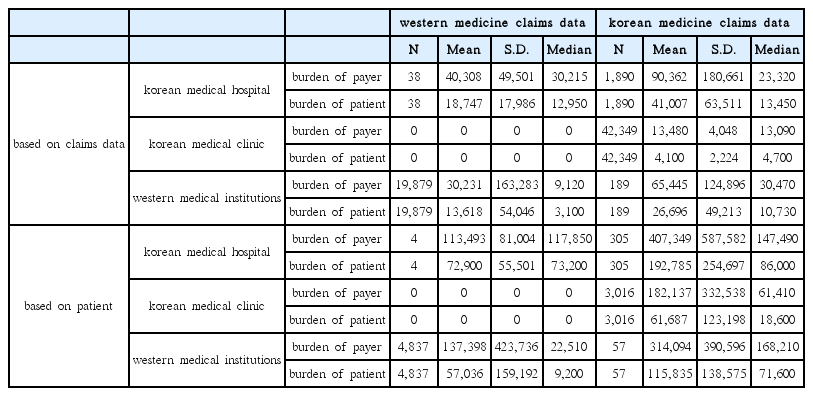
A total of 8,219 people and 64,345 claims data were identified as having facial paralysis. Proportion of outpatient was 95.23%, inpatient 0.84% and patient using both services 3.93%. Mean patient charges was 44,229 won per outpatient, 178,886 won per inpatient and 523,542 won per patient using both services. Utilization of korean medical care institutions was 68.81%(claims), 40.46%(patients), utilization of western medical care institutions was 31.19%(claims), 59.54%(patients). The amount charged by korean medical care institutions was 52.61% and western medical care institutions was 47.39%. Cost per claim was higher than those of the korean treatment and cost per patient of western treatment was lower than those of the korean treatment.
Conclusions:
The research assessed the medical cost and practice pattern associated with facial paralysis. These findings could be used in health care policy and subsequent studies.
Average cost of the claims data based on medical care institutions
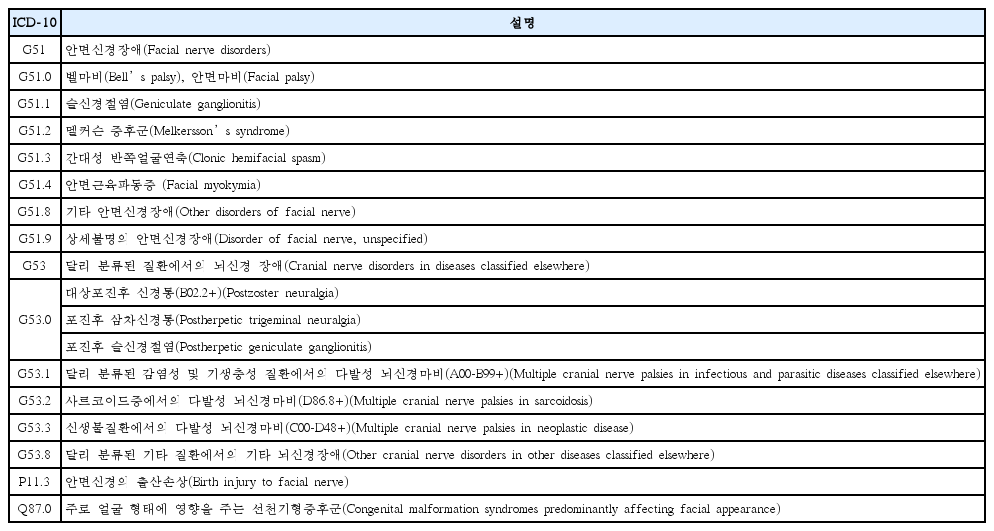
ICD-10 for analysis
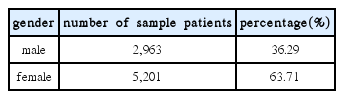
The gender distribution of the sample patients
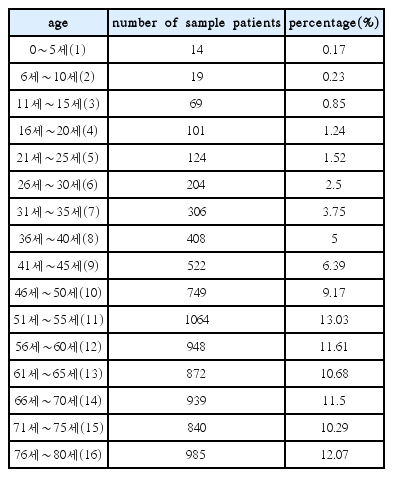
The age distribution of the sample patients
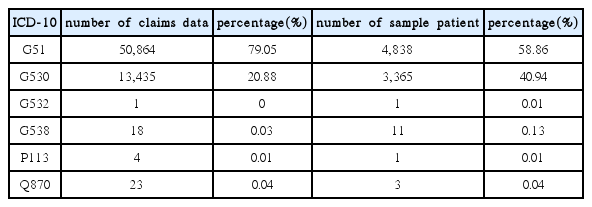
Frequency analysis of ICD-10
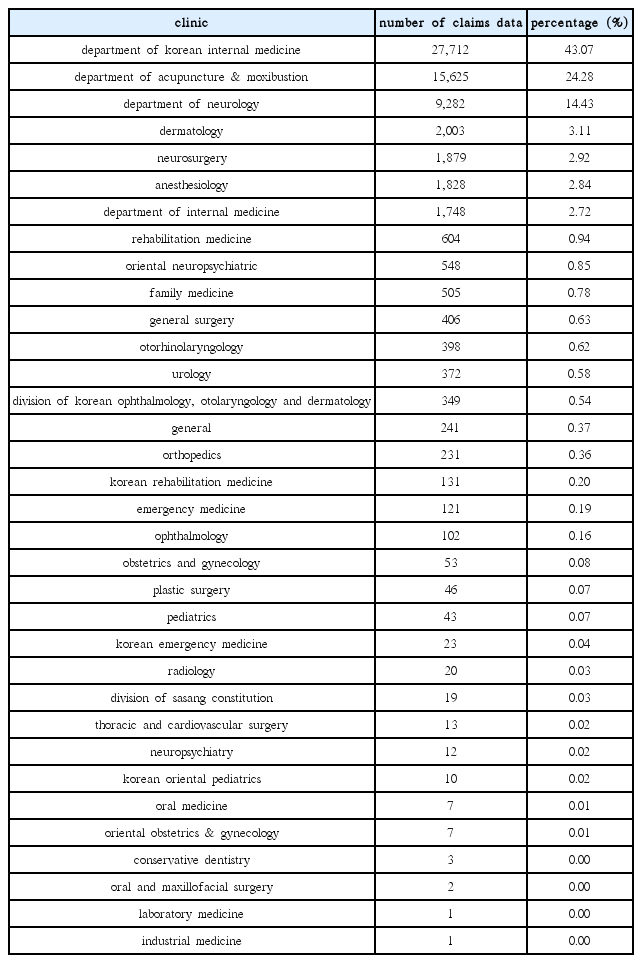
Clinic frequency analysis of claims data
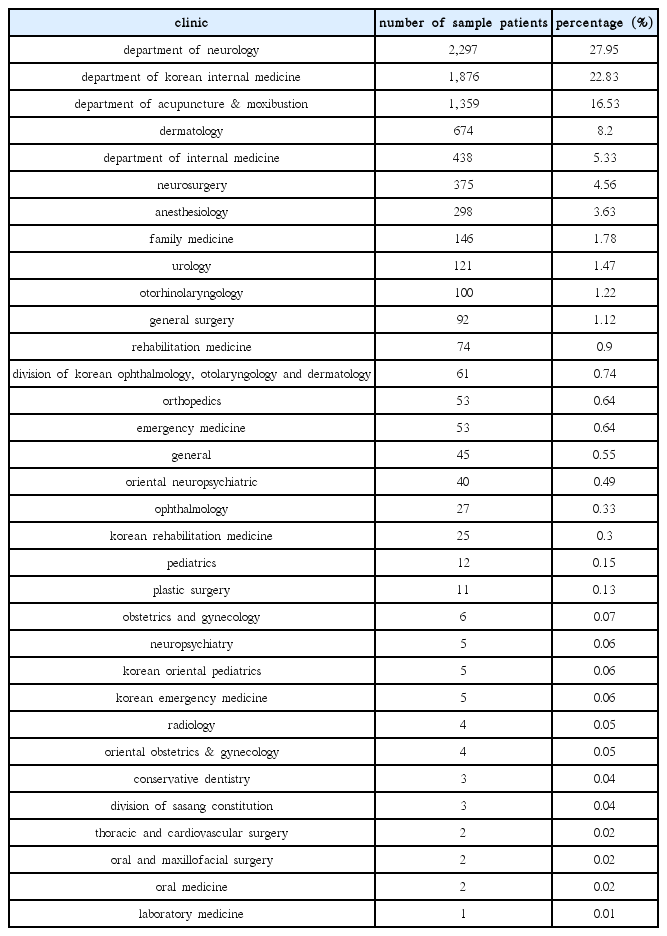
Clinic frequency analysis of sample patients
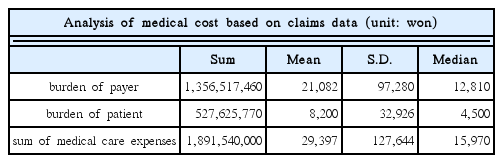
Analysis of medical cost based on claims data and sample patients
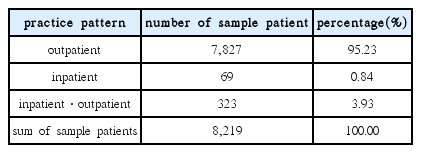
Practice pattern of sample patients
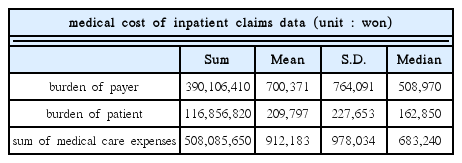
Analysis of medical cost based on the inpatient claims data and outpatient claims data
Analysis of medical cost based on the inpatient and outpatient
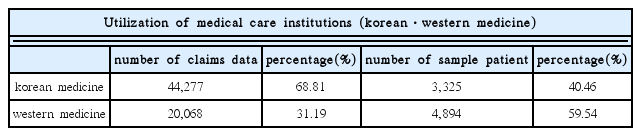
Utilization of each kind of medical care institutions
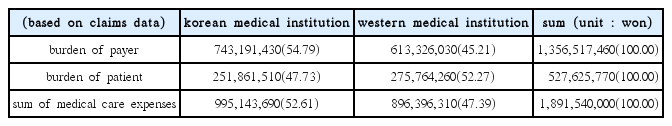
Burden of cost based on medical care institutions
Claims data based on medical care institutions