Effect of Orostachys japonicus on Apoptosis and Autophagy in Human monocytic leukemia Cell line THP-1 via Inhibition of NF-κB and Phosphorylation of p38 MAPK
Article information

Abstract
Objectives
Orostachys japonicas (O. japonicus) has been known for its anti-tumor effect. In the present study, it was investigated whether O. japonicus EtOH extracts could induce apoptosis and autophagy which are part of the main mechanism related to anti-tumor effect in THP-1 cells.
Methods
Cells were treated with various concentrations of O. japonicus EtOH extracts (0–300μg/ml) for 24, 48, and 72h. Cell viability was evaluated by MTS/PMS assay and apoptosis rate was examined by flow cytometry and ELISA assay. The mRNA expression of apoptosis-related genes (Bcl-2, Mcl-1, Survivin, Bax) and autophagy-related gene (mTOR) was evaluated using real-time PCR. The protein expression of Caspase-3, Akt, LC3II, Beclin-1, Atg5, NF-κB, p38, ERK was evaluated using western blot analysis.
Results
O. japonicus EtOH extracts inhibited cell proliferation and apoptosis rate was increased in both flow cytometry and ELISA assay. Bcl-2, Mcl-1, Survivin (anti-apoptosis factors) mRNA expressions were decreased and Bax (pro-apoptosis factor) mRNA level was increased. mTOR mRNA expressions was decreased and LC3II protein expressions was increased. Activation of NF-κB was decreased and phosphorylation of p38 was increased.
Conclusion
O. japonicus is regarded to inhibit cell proliferation, to induce apoptosis and to regulate autophagy-related genes in THP-1 cells via NF-κB and p38 MAPK signaling pathway. This suggests O. japonicus could be an effective herb in treating acute myeloid leukemia.
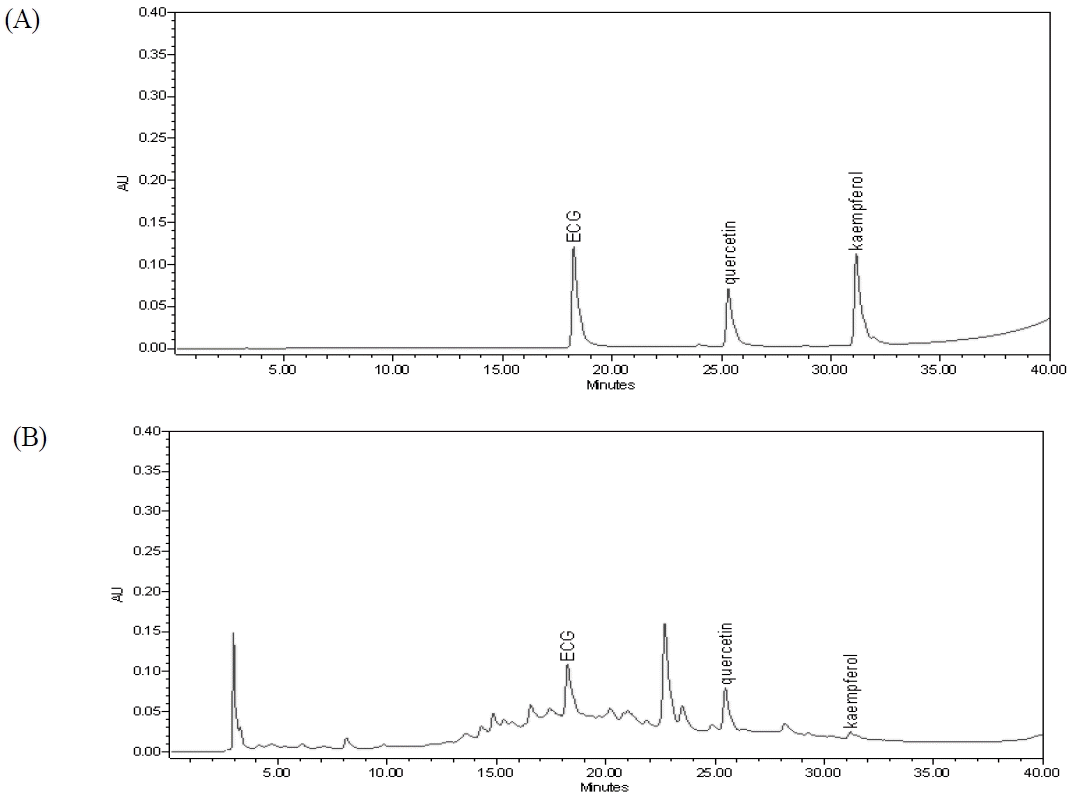
HPLC chromatograms of the representative standards (epicatechin gallate (ECG), quercetin and kaempferol)(A) and the O. japonicus EtOH extracts(B)
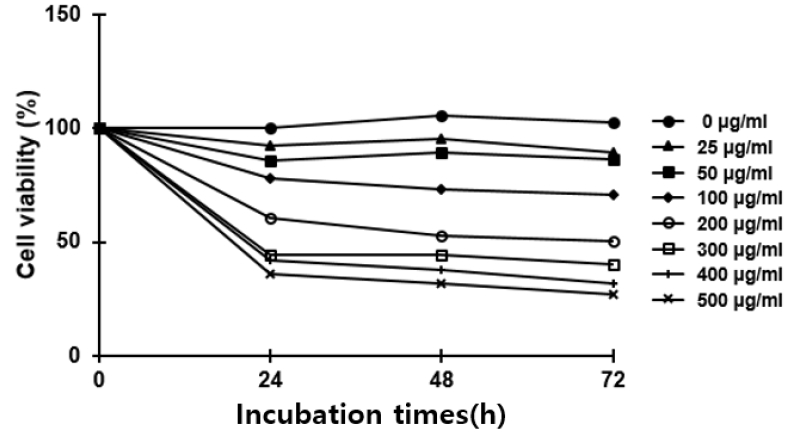
Effects of O. japonicus EtOH extracts on the cell viability in THP-1 cells
Cells were treated with various concentrations of O. japonicus EtOH extracts (0–500μg/ml) for 24, 48, and 72 h. Cell viability was evaluated using MTS/PMS assay. The control group was assigned a value of 100%. The data are the mean±SD of triplicate samples.
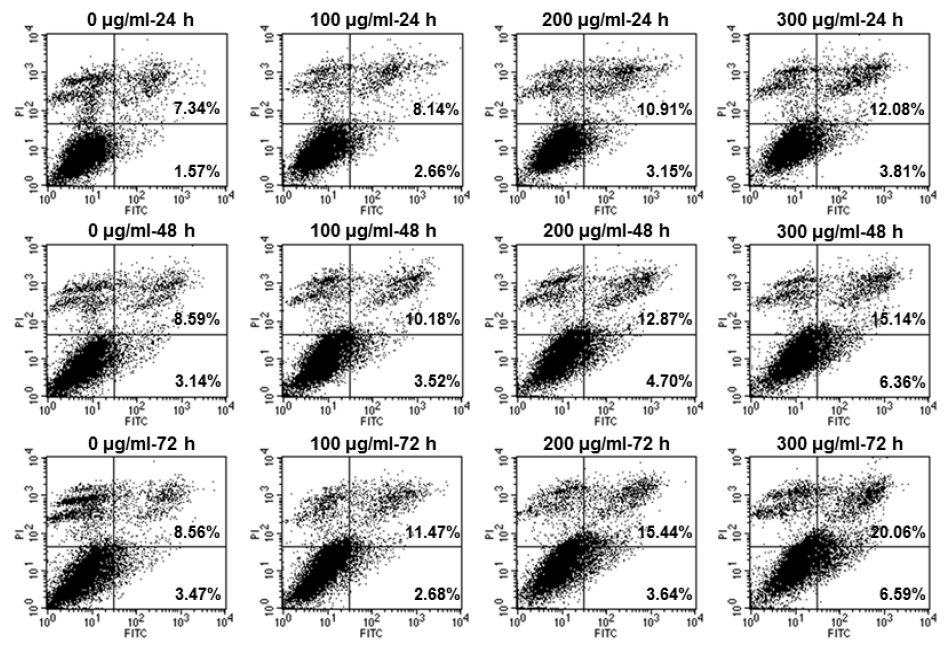
The early and late apoptosis of O. japonicus EtOH extracts in THP-1 cells
Cells were treated with various concentration O. japonicus EtOH extracts (0, 100, 200, 300μg/ml) for 24, 48, and 72h. The apoptosis rate was analyzed using flow cytometry with Annexin V-FITC and PI staining.
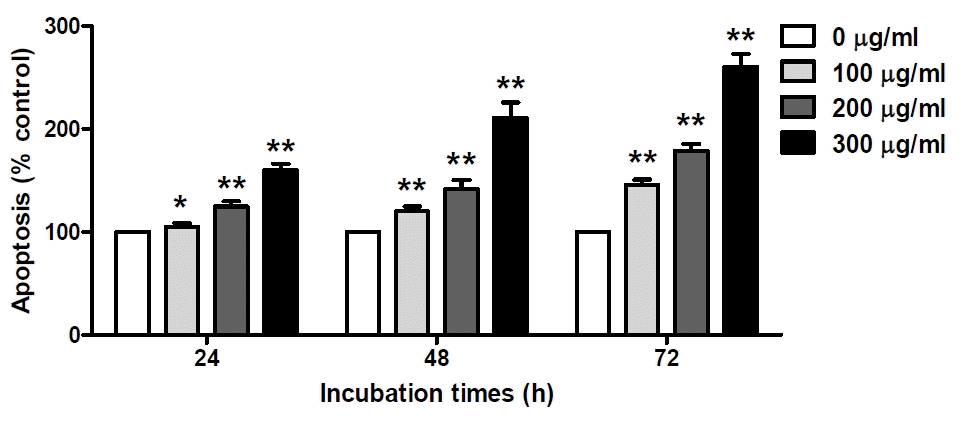
Apoptosis rate of O. japonicus EtOH extracts in THP-1 cells
Cells were treated with various concentration O. japonicus EtOH extracts (0, 100, 200, 300μg/ml) for 24, 48, and 72h. Apoptotic cells were measured using a cell death detection ELISA. The control group was assigned a value of 100%. The data are the mean±SD of triplicate samples. (*p<0.05 and **p<0.01 compared to the control.)
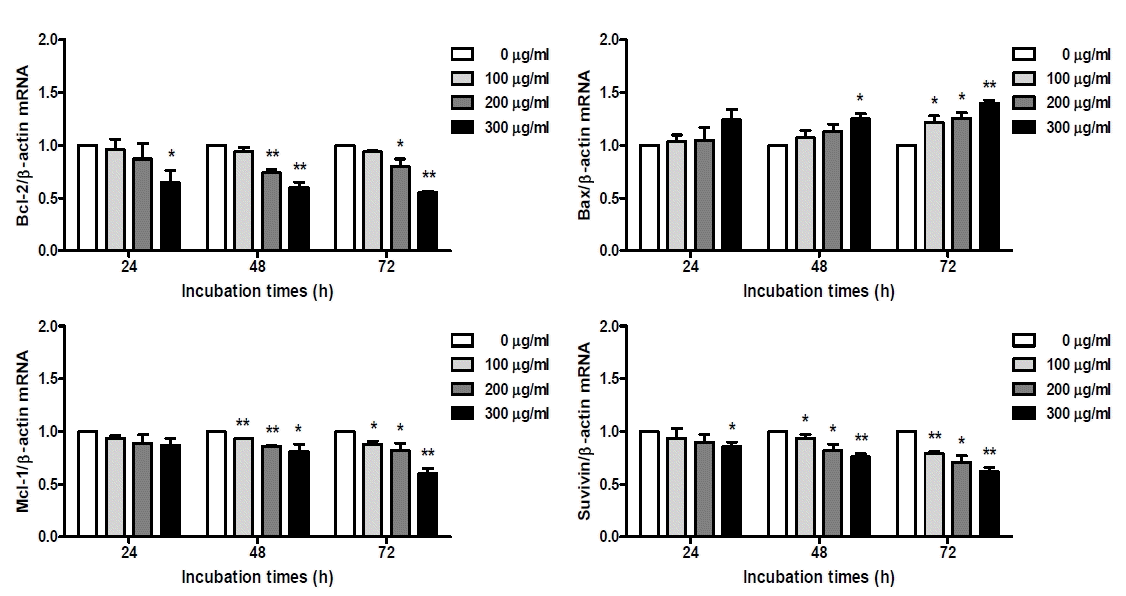
Expression of apoptosis-related genes in O. japonicus extract treated THP-1 cells
Cells were treated with various concentration O. japonicus EtOH extracts (0, 100, 200, 300μg/ml) for 24, 48, and 72h. The mRNA levels were measured by real-time PCR. The crossing point of Bcl-2, Bax, Mcl-1, Survivin with β-actin was applied to the formula, 2-(target gene-β-actin), and relative amounts were quantified. The data are the mean±SD of triplicate samples. (*p<0.05 and **p<0.01 compared to the control.)
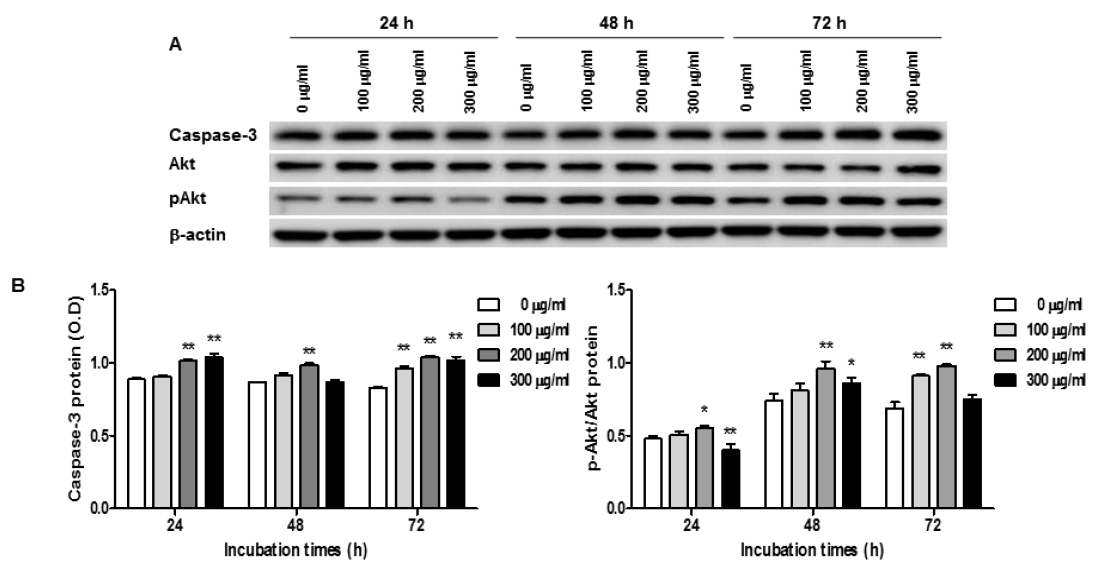
Expression of Caspase-3 and Akt in O. japonicus extract treated THP-1 cells
Cells were treated with various concentration O. japonicus EtOH extracts (0, 100, 200, 300μg/ml) for 24, 48, and 72h. The protein levels were measured by western blot analysis. Cells were lysed and 10μg of soluble protein was separated by electrophoresis on a 10 % SDS-PAGE gel. Densitometry analyses are presented as the relative ratios of caspase-3 and Akt to β-actin. The data are the mean±SD of triplicate samples. (*p<0.05 and **p<0.01 compared to the control.)
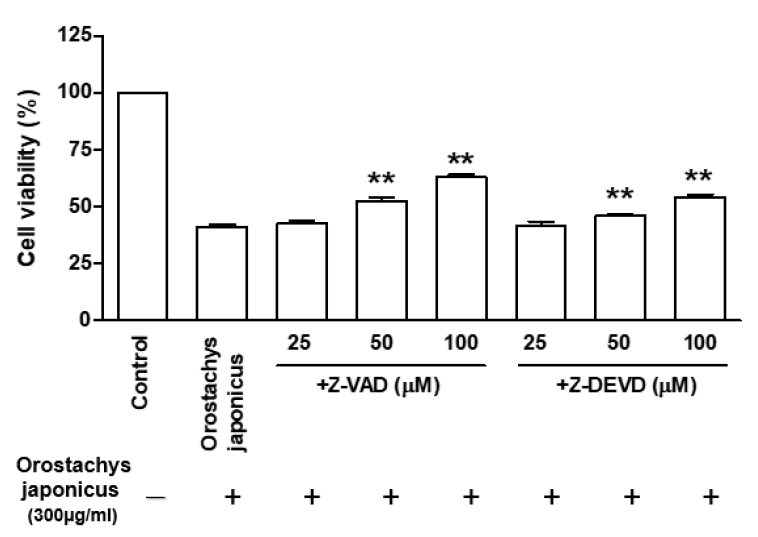
Cell viability in the presence of caspase inhibitors in O. japonicus EtOH extracts treated THP-1 cells
Cells were treated with pan-caspase inhibitor (Z-VAD-FMK) (25–100μM) or caspase-3 inhibitor (Z-DEVD-FMK) (25–100μM) 2h before O. japonicus EtOH extracts treatment (300μg/ml). Cells were incubated for 72h and cell viability was measured by MTS/PMS assay. The data are the mean±SD of triplicate samples. (*p<0.05 and **p<0.01 compared to O. japonicus EtOH extracts-treated cells vs. caspase inhibitor-treated cells with O. japonicus EtOH extracts.)
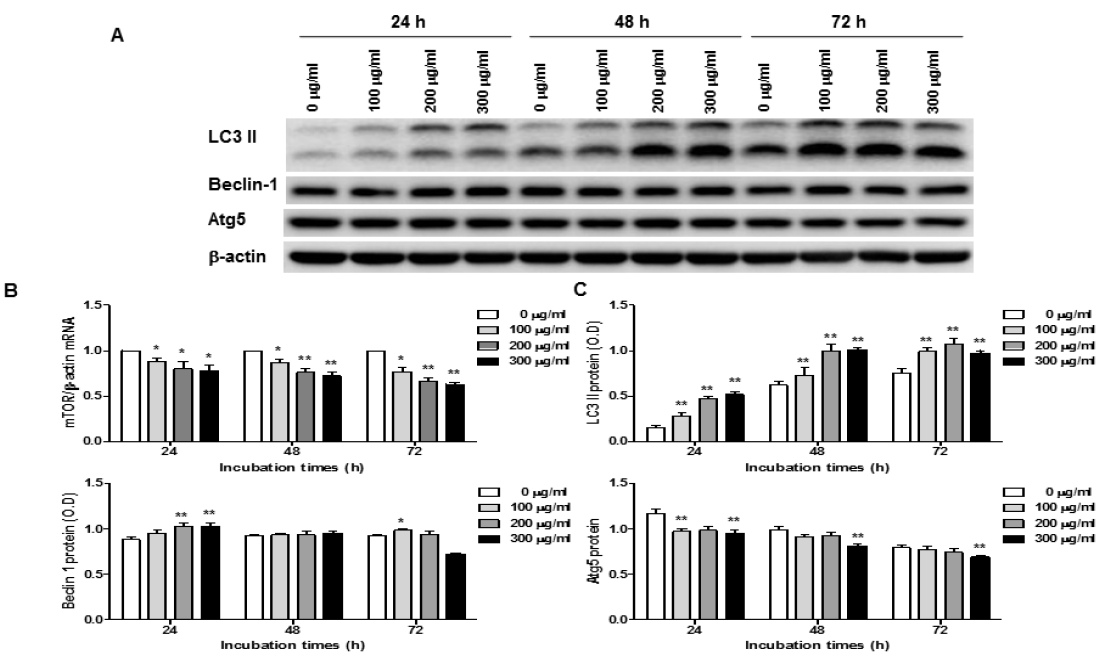
Expression of autophagy-related genes in O. japonicus EtOH extracts treated THP-1 cells
Cells were treated with various concentration O. japonicus EtOH extracts (0, 100, 200, 300μg/ml) for 24, 48, and 72h. The mRNA levels were measured by real-time PCR. The crossing point of mTOR with β-actin was applied to the formula, 2-(target gene-β-actin), and relative amounts were quantified. The protein levels were measured by western blot analysis. Cells were lysed and 10μg of soluble protein was separated by electrophoresis on a 10% SDS-PAGE gel. Densitometry analyses are presented as the relative ratios of LC3 II, Beclin-1 and Atg5 to β-actin. The data are the mean±SD of triplicate samples. (*p<0.05 and **p<0.01 compared to the control.)
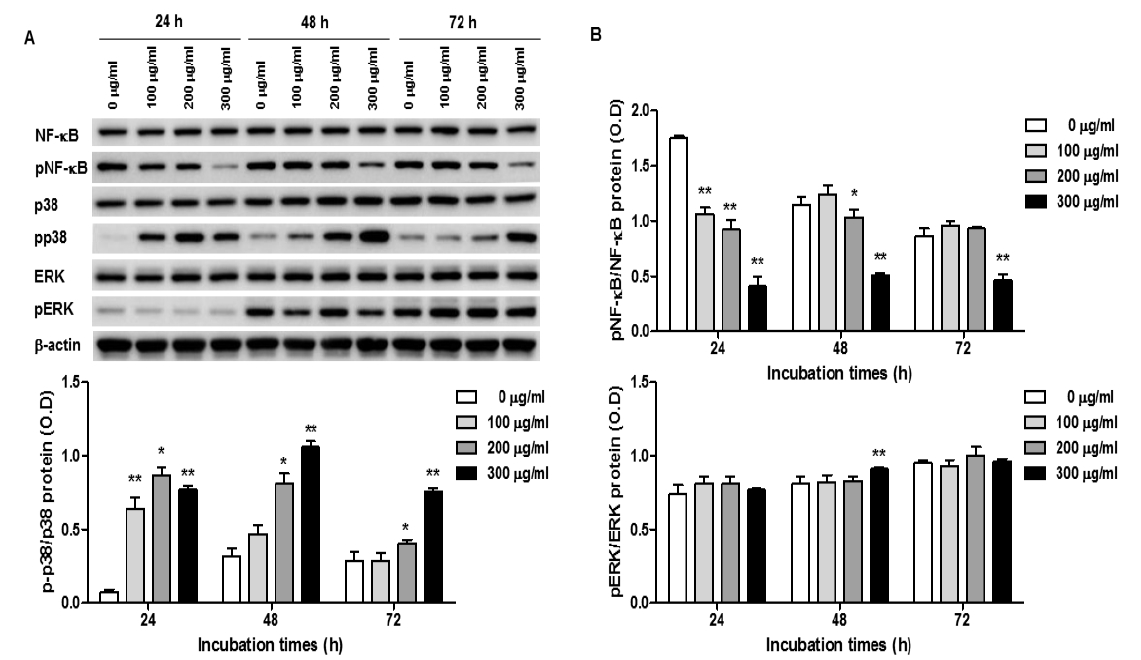
Expression of NF-κB and MAPK signaling pathway in O. japonicus EtOH extracts treated THP-1 cells
Cells were treated with various concentration O. japonicus EtOH extracts (0, 100, 200, 300μg/ml) for 24, 48, and 72h. The protein levels were measured by western blot analysis. Cells were lysed and 10μg of soluble protein was separated by electrophoresis on a 10% SDS-PAGE gel. Densitometry analyses are presented as the relative ratios of NF-B, p38 and ERK1/2 to β-actin. The data are shown as means±SD of three independent samples. (*p<0.05 and **p<0.01 compared to the control.)

Primer Sequences for Real-Time PCR