Effects of Curcuma longa Rhizoma on MIA-induced Osteoarthritis in Rat Model
Article information

Abstract
Objectives
The aim of this study was to investigate the anti-inflammatory effects of Curcuma longa rhizoma extract in an experimental rat model of osteoarthritis.
Methods
Osteoarthritis was induced in rats by injecting monosodium iodoacetate (MIA) into the knee joint cavity of rats. The rats were divided into 5 groups (Normal, Control, positive comparison, low (CL) and high (CH) concentration groups). Rats in the low concentration (CL) group had MIA-induced osteoarthritis; they were treated with Curcuma longa rhizoma extract at a dose of 50mg/kg body weight. Rats in the high concentration (CH) group had MIA-induced osteoarthritis; they were treated with Curcuma longa rhizoma extract at a dose of 100mg /kg body weight. Hind paw weight distribution and ROS levels were measured. At the end of all treatments, changes in alanine aminotransferase (ALT), aspartate aminotransferase (AST), blood urea nitrogen (BUN), and creatinine levels were analyzed. In addition, inflammatory protein levels were evaluated by western blot analysis.
Results
In this study, hind paw weight distribution significantly improved in the CL and CH groups, while. Reactive oxygen species (ROS) production significantly decreased in both. The levels of ALT, AST, BUN, and creatinine did not significantly change in either group. The production of nicotinamide adenine dinucleotide phosphate oxidase 4 (NOX4), p47phox, and Ras-related C3 botulinum toxin substrate 1 (RAC1) decreased in both. Catalase, heme oxygenase-1 (HO-1) and superoxide dismutase (SOD) significantly increased in the CL and CH groups, respectively. Nuclear factor erythroid 2 (Nrf2) increased, but there were no significant differences between the experimental and control groups. Inflammatory cytokines, including nuclear factor-kappa Bp65 (NF-κBp65), interleukin-1beta (IL-1β), and tumor necrosis factor-alpha (TNF-α), decreased significantly in both the CL and CH groups.
Conclusions
Our results showed that Curcuma longa rhizoma extract has anti-inflammatory effects. Anti-inflammatory activity is regulated by the inhibition of inflammatory cytokines and mediators, such as NF-κB, therefore, it suppresses cartilage damage as well.
HPLC profile of combined extract of Curcuma longa rhizoma 30% EtOH extract.
(a) Chemical structure of Curcumin (C21H20O6), (b) Linearity curve of curcumin, (c) HPLC profile of Curcumin and Curcuma longa rhizoma 30% EtOH extract.
Scavenging activity of Curcuma longa rhizoma 30% EtOH extract on DPPH radical.
(A) Scavenging activity of L-ascorbic acid against DPPH radical, (B) Scavenging activity of Curcuma longa rhizoma 30% EtOH extract against DPPH radical.
Scavenging activity of Curcuma longa rhizoma 30% EtOH extract on ABTS radical.
(A) Scavenging activity of L-ascorbic acid against ABTS radical, (B) Scavenging activity of Curcuma longa rhizoma 30% EtOH extract against ABTS radical.
Western blot analysis of Ras-related C3 botulinum toxin substrate 1 (RAC1) expression.
Expression levels in the MIA-induced osteoarthritis rats. Refer to Table 2 for groups. All data are expressed as the means ± SEM, n=6 rats per group. #, Significantly different from the normal (##, p<0.01). *, Significantly different from the control (*, p<0.05).

Western blot analysis of superoxide dismutase (SOD) expression.
Expression levels in the MIA-induced osteoarthritis rats. Refer to Table 2 for groups. All data are expressed as the means ± SEM, n=6 rats per group. #, Significantly different from the normal (#, p<0.05). *, Significantly different from the control (*, p<0.05).
Western blot analysis of nuclear factor-kappa B p65 (NF-κBp65) expression.
Expression levels in the MIA-induced osteoarthritis rats. Refer to Table 2 for groups. All data are expressed as the means ± SEM, n=6 rats per group. #, Significantly different from the normal (##, p<0.01). *, Significantly different from the control (**, p<0.01).
Western blot analysis of tumor necrosis factor-alpha (TNF-α) expression.
Expression levels in the MIA-induced osteoarthritis rats. Refer to Table 2 for groups. All data are expressed as the means ± SEM, n=6 rats per group. #, Significantly different from the normal (##, p<0.01). *, Significantly different from the control (*, p<0.05).
Western blot analysis of interleukin-1beta (IL-1β) expression.
Expression levels in the MIA-induced osteoarthritis rats. Refer to Table 2 for groups. All data are expressed as the means ± SEM, n=6 rats per group. #, Significantly different from the normal (###, p<0.001). *, Significantly different from the control (*, p<0.05 ; **, p<0.01).
Western blot analysis of matrix metalloproteinase-9 (MMP-9) expression.
Expression levels in the MIA-induced osteoarthritis rats. Refer to Table 2 for groups. All data are expressed as the means ± SEM, n=6 rats per group. #, Significantly different from the normal (#, p<0.05). *, Significantly different from the control (*, p<0.05).
Western blot analysis of tissue inhibitor of metalloproteinases 1 (TIMP1) expression.
Expression levels in the MIA-induced osteoarthritis rats. Refer to Table 2 for groups. All data are expressed as the means ± SEM, n=6 rats per group. *, Significantly different from the control (*, p<0.05).
Western blot analysis of tissue inhibitor of metalloproteinases 2 (TIMP2) expression.
Expression levels in the MIA-induced osteoarthritis rats. Refer to Table 2 for groups. All data are expressed as the means ± SEM, n=6 rats per group. There is no significant difference in the experimental groups.
The histological analysis of the knee joint tissues after treatment of CL and CH in MIA-induced osteoarthritis rats (H&E staining, ×200).
In the normal, synovial tissue and cartilage were well observed. In the control, most of aricular cartilage and synovial tissue were destructed. In the CL & CH, articular cartilage and synovial tissue were preserved, compared with the control. (A) Nor, (B) Con, (C) Indo, (D) CL, (E) CH. Refer to Table 2 for groups.
The histological analysis of the knee joint tissues after treatment of CL and CH in MIA-induced osteoarthritis rats (Safranin O staining, × 200).
In the normal, there are much of proteoglycan around the cartilage. In the control, most of proteoglycan was broken down. In the CL & CH, proteoglycan was well preserved compared with the control. Especially, CH group showed histologically similar to normal group. (A) Nor, (B) Con, (C) Indo, (D) CL, (E) CH. Refer to Table 2 for groups.
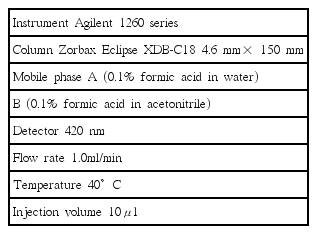
The Operating Condition of HPLC for Analysis of Curcumin
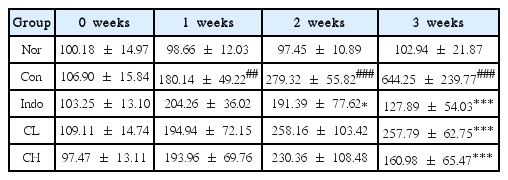
The Changes in Relative Hind Paw Weight Distribution in MIA-induced Osteoarthritis Rats