The Statistics Study on Patients visiting a Korean Medicine Hospital according to the Application of Chuna Therapy Health Insurance and Medical benefits
Article information

Abstract
Objectives
The objective of this study is to analyze and observe what kinds of changes in Patients who visited a Korean Medicine Hospital according to the Application of Chuna Therapy Health Insurance and Medical benefits.
Methods
In this study we collected data of Patients who first visited the OOOO Korean Medicine Hospital from March 8 to May 8. we collected data of 1074 Patients who first visited the Daejeon Jaseng Korean Medicine Hospital from March 8 to May 8. Based on the medical charts, Computer order, we analyze and observe statistical data of 1074 patients putting them into six groups.
Outcuomes
1.The increase in the rate of receiving chuna therapy was significant in Group A and Group B(p <0.05). 2.The increase in the onset of the disease for more than one year was significant in Group C and Group D(p <0.05). 3.The increase in the proportion with disease Corporal was significant in Group E and Group F(p <0.05).
Conclusions
According to according to the Application of Chuna Therapy Health Insurance and Medical benefits, the number of patients receiving Chuna Therapy increased, and people with old illnesses were more likely to receive Chuna Therapy.
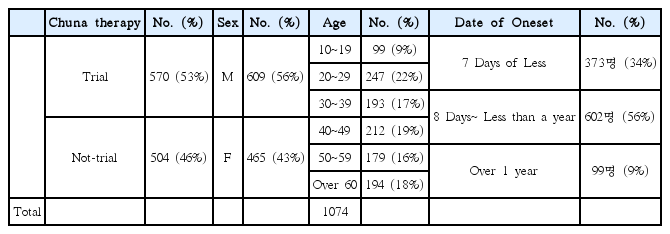
Distribution of Chuna therapy, Sex, Age, Date of Oneset
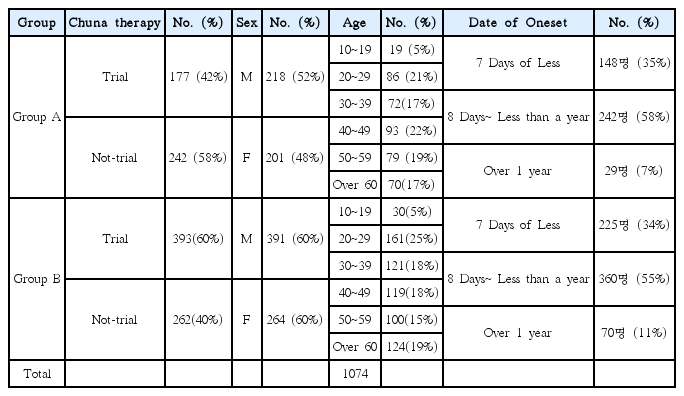
Distribution of Chuna therapy, Sex, Age, Date of Oneset according to Group A, Group B
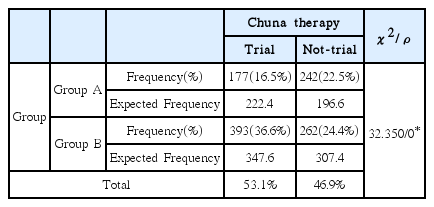
Chi-squared test of chuna therapy according to Group A, Group B
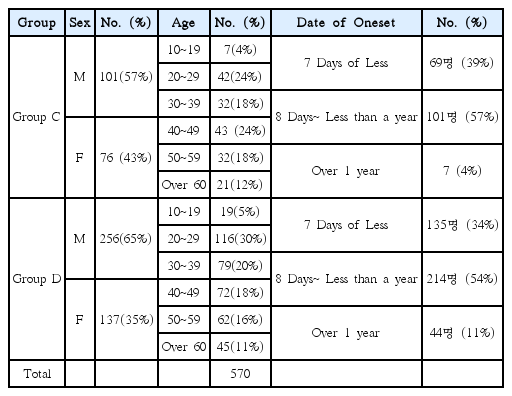
Distribution of Sex, Age, Date of Oneset according to Group C, Group D
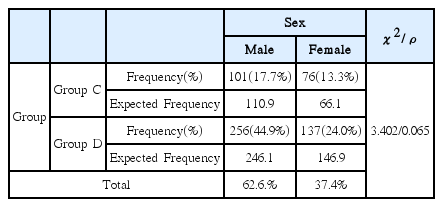
Chi-squared test of Sex according to Group C. Group D
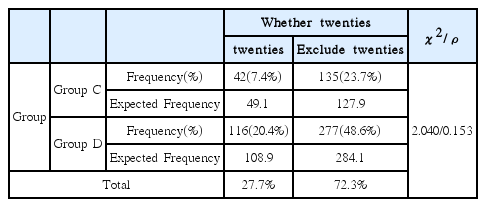
Chi-squared test of Whether they are twenties according to Group C, Group D
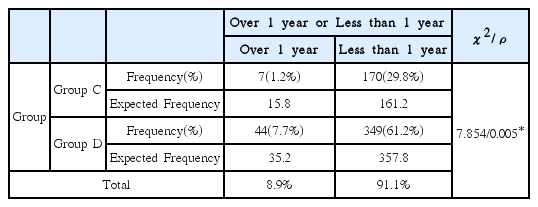
Chi-squared test of Over 1 year or Less than 1 year according to Group C, Group D
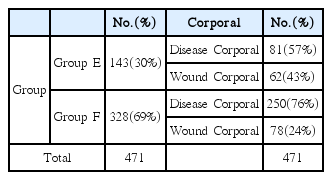
Distribution of Corporal according to Group E, Group F
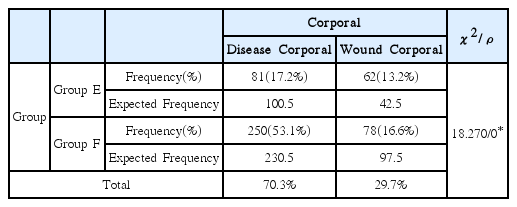
Chi-squared test of Corporal according to Group E, Group F