Kaurenoic acid, a natural substance from traditional herbal medicine, alleviates palmitate induced hepatic lipid accumulation via Nrf2 activation
Article information

Abstract
Objectives
This study was done to look into whether Nrf2 take some role in the anti-lipogenic effect of kaurenoic acid in a nonalcoholic fatty liver disease (NAFLD) cellular model.
Materials and Methods
We measured the effect of kaurenoic acid on intracellular steatosis and Nrf2 activation. Next, the effect of kaurenoic acid on SREBP-1c and some lipogenic genes in palmitate treated HepG2 cells with or without Nrf2 silencing.
Results
The increased SREBP-1c expression was significantly decreased by concomitant kaurenoic acid treatment in non-targeting negative control siRNA transfected HepG2 cells. However, kaurenoic acid did not significantly inhibited increased SREBP-1c level in Nrf2 specific siRNA transfected HepG2 cells
Conclusions
Kaurenoic acid has a potential to activate Nrf2, which may suppress SREBP-1c mediated intracellular steatosis in HepG2 cells.
Introduction
Nonalcoholic fatty liver disease (NAFLD) means hepatic steatosis without secondary causes of hepatic fat accumulation1). It can be just steatosis (nonalcoholic fatty liver) or steatosis with inflammation (nonalcoholic steatohepatitis)2). The overall global prevalence of NAFLD is about 25.24 % and the estimated prevalence of nonalcoholic steatohepatitis ranges 1.5 – 6.45 %3).
Over the past decade, nuclear erythroid 2–related factor 2 (Nrf2) has arisen as an important transcription factor contributing diverse cytoprotective responses. Nrf2 regulates a variety of detoxification proteins, antioxidant enzymes, and efflux transporters, and it is involved in various cellular functions like inflammation, proliferation, and lipid metabolism4). Furthermore, due to its hepatoprotective potential, Nrf2 has recently been considered as a target for new therapeutic approaches to treat liver diseases, including NAFLD5).
Kaurenoic acid is a natural substance, which can be found in several plants, including Aralia continentalis which is a medicinal herb named ‘dokhwal’ in traditional Korean medicine6). In previous studies, it has been confirmed that kaurenoic acid alleviates the intracellular lipid accumulation in HepG2 cells7) and activates Nrf2 in RAW 264.7 cells8).
Here in this study, to further explore the mechanism of the anti-steatosis effect of kaurenoic acid, the relationship between its Nrf2 activating potential and pharmaceutical efficacy was investigated in an experimental NAFLD cellular model.
Materials and Methods
1. Materials
Kaurenoic acid (Kaur-16-en-18-oic acid), palmitate, Nile Red, and sulforaphane were products from Sigma-Aldrich Co. (St. Louis, MO, USA). Nrf2 antibody, SREBP-1 antibody, lamin A/C antibody, and horseradish peroxidase (HRP)-conjugated goat anti-rabbit IgG were products from Santa Cruz Biotechnology (Santa Cruz, CA, USA).
2. Cell culture
HepG2 cells were from American Type Culture Collection (Rockville, MD, USA). The cells were cultured in an incubator set at 37 °C with 5 % CO2 prior to experiment, with Dulbecco’s modified Eagle’s medium (DMEM) containing 100 μg/ml streptomycin, 100 U/ml penicillin, and 10 % (v/v) heat-inactivated fetal bovine serum.
3. Steatosis induction and measurement
For intracellular lipid accumulation, HepG2 cells were incubated in 0.5 mM palmitate containing DMEM for 24h, which incorporates 1% bovine serum albumin. After fixation with 4% paraformaldehyde at room temperature for 15 min, neutral lipid in the cells was stained with 100 ng/ml Nile Red at room temperature for 5 min. Stained lipid was scanned with Olympus FV-1000 confocal laser scanning microscope (Tokyo, Japan), and quantified with ImageJ (Wayne Rasband, Research Services Branch, National Institute of Mental Health, Bethesda, Maryland, USA).
4. Western blot analysis
Total cell extract was prepared by the same way described in previous experiment7), and nuclear proteins were prepared with NE-PER™ nuclear extraction kit (Thermo Scientific, IL, USA) as per the manufacturer’s instruction. After protein quantification by Bradford assay, each extract with equal amount of protein was put for separation in sodium dodecyl sulfate polyacrylamide gel electrophoresis (SDS-PAGE). The separated proteins were transferred to Polyvinylidene fluoride (PVDF) membrane in electroblotting apparatus and blocked using 5% non-fat milk in Tris-buffered saline (TBS) for 1h at room temperature. The PVDF membrane containing the separated protein blots was incubated with each antibody overnight at 4 °C and thereafter with secondary antibodies for 1 h at room temperature. Chemiluminescence detection kit (SuperSignal® West Femto, Thermo Scientific) was used for visualization of the protein bands.
5. Semi-quantitative RT-PCR
RNeasy Mini Kit (Qiagen, Hilden, Germany) was used to prepare total RNA extraction and M-MLV Reverse Transcriptase (Promega, Madison, WI, USA) for cDNA as per each manufacturer’s instruction. Each cDNA was amplified through PCR using TaqPCRx DNA Polymerase (Invitrogen, Carlsbad, CA, USA). The specific primers are as follows (Table 1). PCR was carried out under the following order and conditions: initial denaturation (95 °C, 5 min), 22–30 cycles of denaturation (95 °C, 40 sec), annealing (57 °C, 40 sec), extension (72 °C, 50 sec), and a final extension (72 °C, 7 min). Each amplicon was put and separated on 1.2% agarose gel in 1×TBE buffer (100 V, 30 min). It was stained with ethidium bromide and scanned under UV light. Using GAPDH (Glyceraldehyde-3-phosphate dehydrogenase) as internal control, relative amount of each gene was calculated through densitometric analysis with software ImageJ (Wayne Rasband, Research Services Branch, National Institute of Mental Health, Bethesda, Maryland, USA).
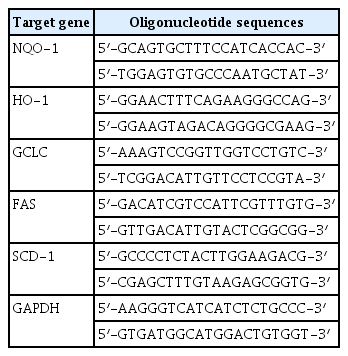
The nucleic acid sequences for each primer
6. Transfection of siRNA
To knockdown Nrf2, HepG2 cells were transfected with Nrf2 specific siRNA (Santa Cruz Biotechnologies, CA, USA) or a non-targeting negative control siRNA (Santa Cruz Biotechnologies, CA, USA) using Lipofectamine ™ LTX and PLUS™ Reagent (Invitrogen, Carlsbad, CA, USA) as per the manufacturer’s protocol. Briefly, HepG2 cells were seeded in a 6-well-plate at a density of 2.5 × 10⁵ cells/well with antibiotics-free medium for 12 h before the transfection. 2 μl of the siRNA (10 μM) were mixed with 10 μl Lipofectamine LTX and 0.5ul PLUS reagent in 100 μl serum-free DMEM medium and were incubated at room temperature for 10 minutes to form a complex. After washing cells with PBS, the 100 μl transfection mixtures were added to each well with 900 μl DMEM medium containing 10% FBS at a final concentration of 20 nM siRNA. 24 hours after the transfection, the medium was replaced with fresh 1ml DMEM medium containing 10% FBS.
7. Statistical analysis
The quantified values were statistically analyzed using student’s t-test and one-way analysis of variance (ANOVA) tests with Tukey’s post hoc test. PASW Statistics Data Editor v23 Korean (SPSS Inc, Chicago, IL, USA) was used for analysis, and the mean differences were considered as statistically significant when the P values were less than 0.05.
Results
1. Kaurenoic acid alleviates palmitate-induced intracellular lipid accumulation in HepG2 cells
In previous study, MTT assay was done in HepG2 cells with various doses of kaurenoic acid to set the safe dose range without cellular toxicity. Viability did not significantly decrease within the range of 10−5 M for 24 hours (data not shown here)7).
Palmitate (0.5 mM) was administered to HepG2 cells to induce intracellular lipid accumulation. Kaurenoic acid (10−7 M) was co-administered to observe the anti-lipogenic effect of kaurenoic acid. After 24h incubation, the cells were stained, scanned, and quantified the Intracellular lipid content according to the protocol, which was fully described in materials and methods. The palmitate induced lipid accumulation was significantly suppressed by 10−7 M kaurenoic acid (Figure 1).
The effect of kaurenoic acid on lipid content in HepG2 cells
Kaurenoic acid (10−7 M) was co-administered with palmitate (0.5 mM) in HepG2 cells. After 24h incubation, Intracellular lipid content was measured as per the protocol. Each value is a relative ratio compared to control (the 1st bar in graph). Bars represent mean±SEM (n=3). The star mark (*) means P<0.05, compared to just palmitate treated cells without KA (the 3rd bar in each graph). Measured absolute values were 5.97±0.57, 5.87±0.56, 13.31±0.75, and 8.59±3.36 respectively, in order from the left bar. Abbreviation: KA, kaurenoic acid.
2. Kaurenoic acid activated Nrf2 and up-regulated the transcription of Nrf2-mediated antioxidant genes in hepG2 cells
HepG2 cells were treated with various amounts of kaurenoic acid for 16 h, and nuclear Nrf2 protein levels were measured by Western blot analysis. As shown in Figure 2, relative Nrf2 levels were elevated by kaurenoic acid.
The effect of kaurenoic acid on Nrf2 expression
Kaurenoic acid (10−9, 10−8, 10−7, and 10−6 M) or sulforaphane (10 μM) was administered to HepG2 cells for 16 h, after which nuclear Nrf2 was detected using western blot analysis. The intensity of each band was calculated over the internal control, Lamin A/C, and converted to relative ratio compared to the control (the 1st bar in graph). Bars represent mean±SEM (n=3). The star mark (*) means P<0.05, compared to the control, which was neither kaurenoic acid nor sulforaphane treated (the 1st bar in graph). Measured absolute values were 5.49±0.70, 7.39±0.45, 9.63±0.75, 10.23±0.62, 10.37±0.82 and 28.32±1.77 respectively, in order from the left bar. Abbreviation: KA, kaurenoic acid.
Subsequently, the mRNA levels of Nrf2 regulated genes, NQO-1, HO-1, and GCLC were measured by semi-quantitative RT-PCR. As shown in Figure 3, the mRNA expression levels of all three Nrf2 regulated genes were also elevated by kaurenoic acid.
The effect of kaurenoic acid on expression of Nrf2 dependent genes
The transcription level of NQO-1 (A), HO-1 (B), and GCLC (C) were measured using semi-quantitative RT-PCR. Each PCR band was measured the optical intensity through densitometric analysis with ImageJ and converted to a relative value over GAPDH. The intensity values were calculated as relative ratios compared to the control (the 1st bar in each graph). Bars represent mean±SEM (n=3). The star mark (*) means P<0.05, compared to the control. Measured absolute values were 2.46±0.03, 14.44±0.77, 14.60±1.75, and 43.64±1.90 (A); 4.11±0.18, 6.85±0.23, 9.45±0.40, and 10.44±0.56 (B); 3.28±0.20, 7.57±0.53, 7.90±0.45, and 10.57±0.60 (C) respectively, in order from the left bar. Abbreviation: KA, kaurenoic acid.
3. kaurenoic acid suppressed expression of SREBP-1c, but did not in Nrf2-silenced HepG2 cells
SREBP-1c is a key regulator in intracellular lipogenesis of live tissue9). We measured the effect of kaurenoic acid on SREBP-1c expression, a key regulator in intracellular lipogenesis of live tissue, in palmitate treated HepG2 cells with or without Nrf2 silencing. The increased SREBP-1c expression was significantly decreased by concomitant kaurenoic acid treatment in non-targeting negative control siRNA transfected HepG2 cells (Figure 4A). However, kaurenoic acid did not significantly decreased increased SREBP-1c level in Nrf2 specific siRNA transfected HepG2 cells (Figure 4B).
The effect of kaurenoic acid on the SREBP-1c expression in Nrf2 siRNA transfected HepG2 cells
Expression levels of SREBP-1c protein were assessed with western blot analysis. The intensity of each band was calculated over the internal control, Lamin A/C. The expression levels of SREBP-1c were expressed as bars on graphs in non-targeting negative control siRNA transfected HepG2 cells (A), and Nrf2 specific siRNA transfected HepG2 cells (B). Each value was converted to a relative ratio compared to control (the 1st bar in each graph). Bars represent mean±SEM (n=3). The star mark (*) means P<0.05, compared to just palmitate treated cells without kaurenoic acid (the 4th bar in each graph). Measured absolute values were 5.26±0.74, 3.86±0.74, 3.84±0.53, 16.94±0.96, 11.22±1.67 and 10.88±1.72 (A); 6.20±0.48, 5.95±0.50, 5.35±0.50, 21.51±3.80, 20.58±3.76 and 17.55±2.24 (B) respectively, in order from the left bar. Abbreviation: KA, kaurenoic acid.
SREBP-1c induces hepatic steatosis by enhancing a set of enzymes, such as FAS and SCD-1 10). When Nrf2 was silenced, kaurenoic acid did not reduced elevated FAS and SCD-1 level in palmitate treated HepG2 cells, too (Figure 5)
The effect of KA on the Lipogenic Genes, FAS and SCD-1 in Nrf2 siRNA transfected HepG2 cells
Expression levels of lipogenic genes were assessed with semi-quantitative RT-PCR. Relative mRNA expression levels of FAS (A) and SCD-1 (B) were expressed as bars on graphs. Each value was converted as a relative ratio compared to control (the 1st bar in each graph). Bars represent mean±SEM (n=3). Measured absolute values were 5.49±0.70, 5.26±0.74, 5.51±0.67, 16.14±1.37, 15.18±1.96 and 15.99±1.42 (A); 6.61±0.70, 6.62±0.67, 6.37±0.74, 18.93±1.88, 19.61±1.35 and 19.09±1.83 (B) respectively, in order from the left bar. Abbreviation: KA, kaurenoic acid.
Discussion
The pathogenic mechanisms in NAFLD are complicated and comprise a series of sequential steps in which a variety of molecular mediators are involved11). It has been recently suggested that Nrf2 activation may alleviate the sequential pathologic processes of NAFLD at several points. First, Nrf2 activation can suppress hepatic lipid accumulation the initial process of the disease12). Nrf2 activation may relieve inflammation by repressing NF-κB13–15) and reduce oxidative stress by increasing SOD and catalase activity16). Another point in which Nrf2 activation may prevent NAFLD is hepatic fibrosis by inhibiting TGF-β17, 18). In this study, we tried to explore whether Nrf2 plays some role in the anti-lipogenic effect of the kaurenoic acid.
SREBP-1c is a key transcription regulator in lipid metabolism and a set of lipogenic genes, such as ACC, FAS, and SCD-1, are induced by SREBP-1c and increase hepatic steatosis19). In previous study, kaurenoic acid reduced the expression of ACC, FAS, and SCD-1 by suppressing SREBP-1c induction7). On another experiment, kaurenoic acid activated Nrf2 in RAW 264.7 cells even though not tested in HepG2 cells8).
So, we hypothesized that Nrf2 activation may be involved in anti-lipogenic effect of kaurenoic acid. In the first place, it was confirmed that kaurenoic acid reduced palmitate induced steatosis and activated Nrf2, and Nrf2 regulated cytoprotective genes, NQO-1, HO-1, and GCLC in HepG2 cells. Next, it was verified that kaurenoic acid did not down-regulated SREBP-1c, FAS, and SCD-1 in Nrf2 specific siRNA transfected HepG2 cells, i.e. kaurenoic acid could not reduce lipogenic genes when Nrf2 activation was blocked. Taken together, it seems that kaurenoic acid to relieves hepatic lipid accumulation by down regulating lipogenic genes through Nrf2 activation. Considering the role of Nrf2 in NAFLD, there could be a possibility that kaurenoic acid also has the potential to subside oxidative stress, inflammation, and even fibrosis.
As of now, there is no proven therapeutic agent though numerous pharmacologic approaches have been examined to treat NAFLD, including insulin sensitizing agents, lipid lowering agents, antioxidants, and etc20). As described above, Nrf2 is emerging as a potential target for new therapeutics in NAFLD5), and our results show that kaurenoic acid can suppress hepatic lipid accumulation through Nrf2 activation. Thus, we expect that kaurenoic acid can be developed as a potent pharmacologic agent for NAFLD.
Conclusions
We provided evidence that the anti-lipogenic effect of kaurenoic acid may be associated with activation of transcription factor Nrf2, which regulates a variety of cytoprotective response and recently emerged as a promising therapeutic target in preventing and treating several types of liver injury and disease, including NAFLD.
Notes
Disclosures
The author does not have a commercial or other association that might have a conflict of interests.
Acknowledgements
This work was supported by a 2-Year Research Grant of Pusan National University.