Investigation of Anti-inflammatory and Anti-oxidative Activities of Lonicerae Flos, Citri Pericarpium and Violae Herba Complex (LCVC)
Article information

Abstract
Objectives
The anti-inflammatory and anti-oxidative activities of LCVC (Lonicerae Flos, Citri Pericarpium and Violae Herba Complex) have not been fully elucidated. The purpose of this study was to investigate the mechanisms underlying these effects in lipopolysaccharide (LPS)-induced RAW 264.7 macrophages.
Methods
The evaluation of the anti-oxidative activity of LCVC was completed via DPPH and ABTS radical scavenging capacity, FRAP assay, measurement of polyphenol and flavonoid, assessment of ROS and NO levels in LPS-induced RAW 264.7 cells. The anti-inflammatory activity was defined by measuring the production of biomarkers (PGE2, IL-1B, IL-6 and TNF-α), proteins (ERK, JNK, P38, Nrf2, Keap1, HO-1 and NQO1) and expressions of genes (iNOS, COX-2, IL-1β, IL-6, TNF-α, Nrf2, Keap1, HO-1 and NQO1) in LPS-induced RAW 264.7 cells.
Results
LCVC have polyphenol and flavonoid contents. The results of DPPH and ABTS free radical scavenging capacity and FRAP assay showed that the anti-oxidative activity was increased. Production of ROS, NO, IL-6, TNF-α, mRNA expressions of IL-1β, IL-6, TNF-α, Keap1, iNOS and COX-2 were decreased, and NQO1, Nrf2, and HO-1 were increased. In protein expression, JNK and Keap1 were decreased, NQO1, Nrf2 and HO-1 were increased, and no relationships were observed with the ERK and P38 by LCVC.
Conclusions
These results suggest that LCVC may offer protective effects against LPS-induced inflammatory and oxidative responses through attenuating Nrf2/HO-1 pathway and MAPKs pathway. Therefore, we propose that LCVC has anti-inflammatory and anti-oxidative activities that have therapeutic potential in the treatment of inflammatory and oxidative disorders caused by the over-activation of macrophages.
Introduction
Inflammation is one of the mechanisms which immune cells, blood vessels, and molecular mediators are activated to defend the body due to infection or trauma1). However, if the inflammatory response is continuous or uncontrolled, excessive production of inflammatory factors can cause various diseases such as reumatoid arthritis (RA), alzhemier’s disease (AD), hepatitis, pneumonia, tumor, and nephritis2,3).
Reactive oxygen species (ROS) generated in the human body can be removed through mechanisms of biological metabolism. However, if the ROS is over produced or oxidative response is uncontrolled, oxidative stress could induce loss of cell function and apoptosis. It could cause variety of systemic problems to the kidney, liver, heart, blood vessels, skin, etc4).
Macrophages are one of the factors that activate the innate immune responses. They defend the body and repair cells by delicately regulating the signaling pathways that mediate the immune response5). Macrophages manage primary defense role at the body and if it react with Lipopolysaccharide (LPS) which is one of the main components of the outer membrane surrounding the peptide glycan of the surface layer of Gram-negative bacteria, they activate to cause inflammation by producing interleukin-6 (IL-6), interleukin-1β (IL-1β), cyclooxygenase-2 (COX-2), prostaglandin e2 (PGE2), tumor necrosis factor-α (TNF-α), iNOS (inducible nitric oxide synthase), nitric oxide (NO), and other various inflammatory mediators6–8).
NO, one of the major inflammatory mediators causing inflammatory diseases, plays an important role in cell signal transduction and is involved in various biopathological processes. It can cause DNA damage and mutations9). COX-2 over-produces PGE2, which can cause pain, fever, excessive inflammation, and cancer10). Nuclear factor erythroid 2-related factor 2 (Nrf2) plays a major role in inhibiting inflammatory processes, and Nrf2 activators are utilized in the treatment of various inflammatory diseases11). Heme oxygenase-1 (HO-1), a target of Nrf2, is an enzyme that promotes the decomposition of carbon monoxide (CO), biliverdin, and free iron. It reduces the production of inflammatory mediators and promotes the production of anti-inflammatory cytokines12). It is known that HO-1 plays a very important role in the mechanism of protecting cells from inflammatory and oxidative stress, and also regulates NO production of activated macrophages13). The mitogen-activated protein kinase (MAPK) pathway plays an important role in the inflammatory response. That process is activated by extracellular signal-regulated kinase (ERK), stress-activated protein kinase (JNK), and p38 mitogen-activated protein kinase (p38MAPK)8). LPS stimulation activate phosphorylation of ERK, JNK, and p38 to cause inflammation.
According to Herbology, the Lonicerae Flos, Violae Herba is classified as drugs for eliminating heat and relieiving toxicity, and the Citri Pericarpium for Regulating Ki Flow. It is reported that these herbal medicines have pharmacological effects such as anti-oxidative, anti-inflammatory, and anti-tumor effect. Lonicerae Flos is effective for anti-fungal, and eliminating pathogenic heat from blood to cure dysentery14). Pharmacologically, it is reported to have antibacterial, anti-oxidative, anti-inflammatory, and anticancer effect15). As the Violae Herba is effective for clearing away heat from the Yeong and the blood systems, it has been prescribed as a drug to treat skin inflammation, enteritis, tuberculosis, and inflammatory diseases. Pharmacologically, it exhibits various physiological activities such as antioxidant, anti-inflammatory, pain suppression, brain cell protection, and antibacterial action against various pathogenic microorganisms such as Staphylococcus aureus, Pseudomonas aeruginosa, dermatococcus, and pneumococcus16,17). As the Citri Pericarpium has the effects of controlling qi, eliminating dampness and phlegm, it has been prescribed as a drug to treat bloating, anorexia, vomiting, nausea, cough18). Pharmacologically, it is reported to have physiological activities such as antibacterial, antioxidant, anticancer, anti-inflammatory, and anti-obesity effects19). According to previous studies, it has been demonstrated that Lonicerae Flos, Citri Pericarpium, and Violae Herba individually exhibit anti-inflammatory effects. As Lonicerae Flos and Violae Herba have similar medicinal properties, those are used in combination with each other in various inflammatory diseases, such as prostatitis, appendicitis, and mastitis14). Citri Pericarpium is used clinically as a prescription in combination with Lonicerae Flos and Violae Herba20). As such combinations of prescription are widely used in clinical fields, effective verification of the anti-inflammatory effects of those would be of great help in the clinical evidence. However, research on complexes composed of these three herbs, Lonicerae Flos, Citri Pericarpium, and Violae Herba has not been implemented before. Therefore, the author administered LCVC to LPS-induced RAW 264.7 macrophages to measure changes of inflammatory mediators such as NO and PGE2, inflammatory cytokines such as TNF-α and IL-1β, and inflammatory response mediators such as ROS. Furthermore, additional experiments were conducted to find out relationship with Nrf2/HO-1 pathway which is a strong antioxidant activity signaling pathway and MAPKs which is a major intracellular signaling pathway associated with antioxidant and anti-inflammatory effects. This study is reported as valid results were obtained by analyzing those factors.
Materials & methods
1. Materials
1) Sample
Lonicerae Flos, Citri Pericarpium, and Violae Herba Complex (LCVC) used in the experiment were purchased from Daejeon Korean medical pharmacy, Daejeon, Republic of Korea and used after removing unnecessary materials other than the medicinal part at the Department of Korean Pathology from Daejeon University.
2) Reagent
Gallic acid (Sigma, U.S.A.), ethanol (Merck, Germany), folin-Ciocalteu’s phenol reagent (Merck, Germany), quercertin (Sigma, U.S.A.), aluminum nitrate nonahydrate (Sigma, U.S.A.), sodium carbonate (Sigma, U.S.A.), potassium acetate solution (Sigma, U.S.A.), 1,1–diphenyl–2-picrylhydrazyl (DPPH : Sigma, U.S.A.), 2,2′-azinobis-(3-ethylbenzothiazoline-6-sulfonic acid) (ABTS : Sigma, U.S.A.), Dulbecco’s modified eagle’s medium (DMEM : Gibco, U.S.A.), fetal bovine serum (FBS : Gibco, U.S.A.), penicillin-streptomycin (Sigma, U.S.A.), lipopolysaccharides from Escherichia coli O111:B4 (Sigma, U.S.A.), EZ-cytox (Daeilab, Korea), dulbecco’s phosphate buffered saline (D-PBS : Welgene, Korea), trypan blue (Sigma, U.S.A.), accupower® cyclescript RT premix (dT20) (Bioneer, Korea), NO (Nitrix Oxide) plus detection kit (Intronbio, Korea), easy-spin™ total RNA extraction kit (Intronbio, Korea), DEPC-DW (Bioneer, Korea), mouse IL-1 beta ELISA kit (Komabiotech, Korea), qPCRBIO SyGreen Blue Mix Lo-ROX (PCR Biosystems, U.S.A.), mouse IL-6 ELISA kit (Komabiotech, Korea), mouse TNF-alpha ELISA kit (Komabiotech, Korea), RIPA lysis and extraction buffer (Thermo Fisher, U.S.A.), protease inhibitor cocktail (Sigma, U.S.A.), phosphatase inhibitor cocktail 2 (Sigma, U.S.A.), phosphatase inhibitor cocktail 3 (Sigma, U.S.A.), sample buffer (Laemmli’s 5x) (ELPISbiotech, Korea), Pierce™ BCA protein assay Kit (Thermo Fisher, U.S.A), 1.5M Tris-HCl, pH 8.8 w/SDS (Intronbio, Korea), 0.5M Tris-HCl, pH 6.8 w/SDS (Intronbio, Korea), Acrylamide-Bis Solution 30%, 29:1 (Intronbio, Korea), 10% ammonium persulfate (Thermo Fisher, U.S.A), TEMED (Bio-RAD, U.S.A.), 10X Tris-Glycine-SDS buffer (Intronbio, Korea), GangNam-STAIN™ prestained protein ladder (Intronbio, Korea), 10X transfer Buffer (Intronbio, Korea), methyl alcohol (Samchunchemicals, Korea), 10X TBS with Tween 20 (Intronbio, Korea), ultra pure bovine serum albumin (BSA : GenDEPOT, U.S.A.), Phospho-p44/42 MAPK (Erk1/2) (Thr202/Tyr204) (D13.14.4E) XP® Rabbit mAb (Cell signaling, U.S.A.), p44/42 MAPK (Erk1/2) (137F5) Rabbit mAb (Cell signaling, U.S.A.), Phospho-SAPK/JNK (Thr183/Tyr185) (G9) Mouse mAb (Cell signaling, U.S.A.), SAPK/JNK Antibody (Cell signaling, U.S.A.), Phospho-p38 MAPK (Thr180/Tyr182) (D3F9) XP® Rabbit mAb (Cell signaling, U.S.A.), NRF2 (D1Z9C) Antibody (Cell signaling, U.S.A.), KEAP1 (D6B12) Antibody (Cell signaling, U.S.A.), p38 MAPK Antibody (Cell signaling, U.S.A.), NQO1 Antibody (Abcam, UK), HO-1 (E3F4S) Antibody (Cell signaling, U.S.A.), peroxidase-conjugated affinipure goat anti-mouse IgG (H+L) (Jackson immunoresearch, U.S.A.), miracle-star™, peroxidase-conjugated affinipure goat anti-rabbit IgG (H+L) (Jackson immunoresearch, U.S.A.), western blot detection system (Intronbio, Korea) were used in the experiment.
3) Machine
Heating mantle with stirring for extraction apparatus (Misung scientific, Korea), rotary vacuum evaporator (EYELA FDU-540, Japan), freeze dryer (Ilshin biobase, Korea), autoclave (Sanyo, Japan), CO2 incubator (Sanyo, Japan), vortex mixer (Vision scientific, Korea), clean bench (Vision scientific, Korea), deep-freezer (Sanyo, Japan), centrifuge (Hanil, Korea), micro plate reader (Molecular Devices, U.S.A.), ice-maker (Brema, Australia), alpha cycler 1 PCRmax (PCRmax, U.K.), plate shaker (Lab-Line, U.S.A.), nanodrop (Thermo Fisher, U.S.A.), mini trans-Blot (Bio-RAD, U.S.A.), Rotor-Gene Q (Qiagen, Germany), funsion FX (Vilber, U.S.A.) were used in the experiment
2. Methods
1) Preparation of herbal complex extract
500 ml of distilled water was added to the amount of 1 tablet of the LCVC and heat reflux extracted for 3 hours. The extract was filtered with filter paper, concentrated under reduced pressure with a rotary vacuum evaporator, and freeze-dried using a freeze dryer to obtain 4.61 g (yield 15.38%) of powder. After that, it was stored in a cryogenic freezer (−80°C) and diluted in distilled water according to the concentration required for the experiment. The contents and dose of the prescription used in this experiment are as follows (Table 1).
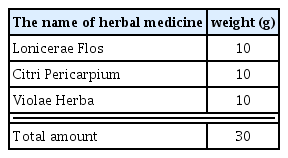
The prescription of LCVC
2) Evaluation of antioxidant efficacy
(1) Measurement of total polyphenol content
LCVC was set at concentration of 1 mg/ml. 0.5 ml of 50% FoilnCiocalteu’s phenol reagent was added to 1 ml of LCVC and reacted at room temperature for 3 minutes. The reaction solution was sequentially mixed with 7.5 ml of distilled water and 1 ml of saturated Na2CO3 solution, standed for 30 minutes, centrifuged at an intensity of 14,000 g for 10 minutes, and absorbance at a wavelength of 760 nm was measured by taking the supernatant. The total phenol content was calculated according to the calibration curve prepared using gallic acid as a standard material.
(2) Measurement of total flavonoid content
The 0.5 ml mixture was made by mixing 0.1 ml of LCVC with a concentration of 1 mg/ml and 0.9 ml of 80% ethanol. 10% aluminum nitrate, 1 M potassium acetate 0.1 ml and 4.3 ml of 80% ethanol were added at the mixture. After those procedures, the mixture was left at room temperature for 40 minutes. Then, the absorbance at 415 nm wavelength was measured, and the content was obtained through a standard curve prepared using quercetin.
(3) Measurement of DPPH radical scavenging activity
The final concentrations of LCVC were diluted to 1, 10, 100, and 1000 μg/ml, respectively, and 150 μl of 0.2 mM DPPH solution dissolved in ethanol and 100 μl of LCVC were mixed and reacted at 37° C for 30 minutes. And the absorbance at a wavelength of 517 nm was measured. Distilled water was added as a control group of the sample, and ethanol was added as a control group for the DPPH solution to derive a correction value. The calculation of the DPPH radical scavenging ability was performed as follows.
(4) ABTS radical scavenging activity
The final concentrations of LCVC were diluted to 1, 10, 100, and 1000 μg/ml, respectively, and the ABTS solution was made by mixing 7.4 mM ABTS (2,2-azino-bis-(3-ethylbenzothiazoline-6-sulfonic acid)) and 2.6 mM potassium persulphate. Thereafter, the prepared ABTS was left in a dark place for one day to form cations (ABTS·+), the absorbance was measured at 732 nm, diluted until absorbance value was 1.5 or less, and 150 μl of the diluted ABTS·+ solution and LCVC 5 μl of each was mixed and reacted at room temperature for 10 minutes, and absorbance was measured at 732 nm wavelength. ABTS radical scavenging ability was calculated as follows.
(5) Measurement of FRAP activity
FRAP regent was prepared by mixing 10 mM TPTZ and 20 mM FeCl3 dissolved in 300 mM sodium acetate buffer (pH 3.6) and 40 mM HCl in a ratio of 10:1:1, respectively. After that, 100 μl of LCVC of 1, 5, 10, and 50 μg/ml and 900 μl of distilled water were added to a 15 mL tube, and 2 mL of FRAP regent was added to the mixed solution, followed by reaction in the dark for 30 minutes. After the reaction, absorbance was measured at a wavelength of 593 nm, and antioxidant activity was obtained according to a calibration curve prepared using FeSO4 as a standard material.
3) Cell culture
RAW 264.7 cells were subcultured every 2–3 days in a cell incubator maintained at 37°C and 5% CO2 environment using DMEM medium composed of 10% fetal bovine serum and 1% penicillin-streptomycin.
4) Measurement of cell viability
RAW 264.7 cells were aliquoted into a 24 well plate at 5×10⁴ cells/well and cultured for 24 hours, then LCVC was treated at concentrations of 50, 100, and 200 μg/ml, and cultured again for 24 hours. After 24 hours, 10 μl of EZ-Cytox solution per 100 μl of the cell culture medium was added and reacted in a cell incubator for 30 minutes. After the reaction, the change in absorbance seen at a wavelength of 450 nm was measured, and the cell viability relative to the control was expressed as a percentage.
5) Measurement of ROS production
RAW 264.7 cells were seeded in a 24 well plate at 5×10⁴ cells/well and cultured for 24 hours. The normal group was not treated with LCVC and LPS, and the control group was treated with only LPS at a concentration of 100 ng/ml. The experimental group was treated with LCVC at a concentration of 50, 100, and 200 μ g/ml and LPS at a concentration of 100 ng/ml, and incubated for 24 hours again. Thereafter, the cells collected by centrifugation at 1200 rpm for 5 minutes were washed twice with cold PBS, DCF-DA and added to a concentration of 10 μM, and placed at room temperature in a dark place for 30 minutes. After staining, cold PBS was added, centrifuged at 1200 rpm for 5 minutes, the supernatant was removed, and 400 μl of PBS was suspended again. After that, the change of the fluorescence intensity of the remaining solution was measured with a flow cytometer and expressed as a percentage of the control.
6) Measurement of NO production
RAW 264.7 cells were seeded in a 24-well plate at 5×10⁴ cells/well and cultured for 24 hours. The normal group was not treated with LCVC and LPS, and the control group was LPS at a concentration of 100 ng/ml. only processed. The experimental group was treated with LCVC at a concentration of 50, 100, and 200 μg/ml and LPS at a concentration of 100 ng/ml and incubated for 24 hours again. After incubation, 100 μl of the cell culture medium was added to a 96 well plate, 50 μl of N1 buffer was added, and reacted at room temperature for 10 minutes. After the reaction, 50 μl of N2 buffer was added and reacted at room temperature for 10 minutes. After the reaction, the change in absorbance at 540 nm was measured, and the production amount relative to the control was expressed as a percentage.
7) Measurement of biomarker production
RAW 264.7 cells were seeded in a 6-well plate at 3×10⁵ cells/well and cultured for 24 hours. After incubation, the normal group was not treated with LCVC and LPS, and the control group was treated with only LPS at a concentration of 100 ng/ml. The experimental group was treated with LCVC at a concentration of 50, 100, and 200 μg/ml and LPS at a concentration of 100 ng/ml and incubated for 24 hours again. Then, 100 μl of the cell culture solution was added to a 96 well plate and reacted at room temperature for 2 hours. After the reaction, the reagents on the plate were discarded, and washing buffer was added and washed 4 times. After washing, 100 μl of detection antibody was added and reacted at room temperature for 2 hours. After the reaction, 100 μl of streptavidin-HRP was added to the plate and allowed to react at room temperature for 30 minutes. After the reaction, 100 μl of TMB or pink-ONE solution was put into each well, reacted for 15 minutes, 100 μl of stop solution was added, and absorbance was measured at 450 nm through a micro reader, and the absolute value was displayed based on a standard curve.
8) Measurement of gene expression
(1) Extraction of RNA
RAW264.7 cells were seeded in a 6-well plate at 3×10⁵ cells/well and cultured for 24 hours. After incubation, the normal group was not treated with LCVC and LPS, and the control group was treated with only LPS at a concentration of 100 ng/ml. The experimental group was additionally treated with LCVC at a concentration of 50, 100, and 200 μg/ml and LPS at a concentration of 100 ng/ml, and incubated for 24 hours again. Thereafter, 1 ml of easy blue and 200 μl of chloroform were added to the cells, vortexed, and centrifuged at 13000 rpm and 4° C. for 10 minutes. After 400 μl of the supernatant and 400 μl of binding buffer were reacted at room temperature for 1 minute, 700 μl of the reaction solution was injected into the column and centrifuged at 13000 rpm for 30 seconds. 700 μl of washing buffer A was added to the column and centrifuged at 13000 rpm for 30 seconds. Then, 700 μl of washing buffer B was added and centrifuged in the same manner. After replacing the bottom of the column with a 1.5 ml tube, 30 μl of elution buffer was added to the column, reacted for 1 minute, and centrifuged at 13000 rpm for 1 minute to extract total RNA.
(2) cDNA synthesis
For the reverse transcription reaction, 1 μg of total RNA mixture (reaction buffer, dNTPs mixture, RNase inhibitor, stabilizer, oligo dT15 primer) of the RT premix kit was added, and DEPC-DW was added so that the final volume was 20 μl. After mixing this mixture well, react at 45°C for 60 minutes to synthesize first-strand cDNA, and leave at 95°C for 5 minutes to inactivate M-MLV RT and completed cDNA was used for polymerase chain reaction (PCR)
(3) Gene amplification
Real-time PCR was performed to amplify the synthesized cDNA, and put 1 μl of cDNA, 2 μl of each primer, 10 μl of SYBR Green, and 5 μl of DEPC-DW into a real time specialized tube and react at 95°C for 2 minutes. Then, the gene was amplified by repeating 40 times for 5 seconds at 95°C and 30 seconds at 62.5°C. The gene expression level was calculated compared to the control group, and the sequences of the primers used are shown in Table 2.
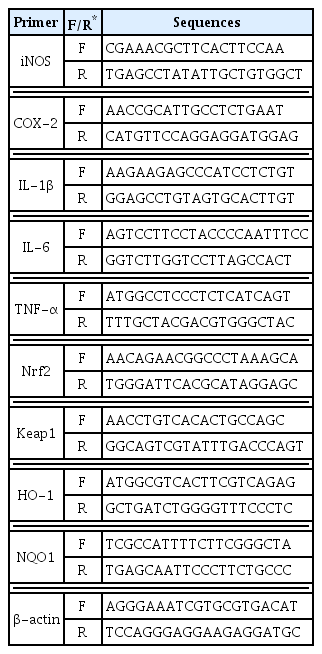
The Sequences of Primers
9) Measurement of protein expression level
RAW264.7 cells were seeded in a 6-well plate at 3×10⁵ cells/well and cultured for 24 hours. After incubation, the normal group was not treated with LCVC and LPS, and the control group was treated with only LPS at a concentration of 100 ng/ml. The experimental group was treated with either LCVC at a concentration of 50, 100, or 200 μg/ml and LCVC at a concentration of 100 ng/ml, or additionally treated with 100 ng/ml LPS and cultured again for 24 hours. Thereafter, RIPA buffer containing protease inhibitor cocktail I and phosphatase inhibitor II and III was added to the cells to extract proteins. The extracted protein was quantified using a pierce BCA protein assay kit, mixed with sample loading buffer, and reacted at 95°C for 5 minutes to prepare. The prepared proteins were separated by size by SDS-PAGE through 10% acrylamide gel, and transferred to a PVDF membrane. The protein-transferred membrane was immersed in 5% BSA and reacted at room temperature for 2 hours. After washing 3 times with TBS-T buffer, p-ERK (1:2000), ERK (1:1000), p-JNK (1:2000), JNK (1:1000), p-P38 (1:1000) ), P38 (1:1000), Nrf2 (1:1000), Keap1 (1:1000), HO-1 (1:1000), NQO1 (1:1000), β-actin (1:5000) first antibody and reacted at 4°C for 14 hours. After washing again 5 times, the secondary antibody (1:10000) was added and reacted at room temperature for a hour, washed again 10 times, and the protein was developed through ECL solution. Then, the protein expression level was analyzed through chemidoc fusion FX.
3. Statistical processing
SPSS 21.0 was used to analyze experimental results which were expressed as mean±standard error of mean, multiple comparisons were performed using ANOVA, and significance was tested at p<0.05, p<0.01, and p<0.001 levels through Tukey’s HSD test
Results
1. Total polyphenol and flavonoid content of LCVC
As a result of measuring the total polyphenol content in LCVC using gallic acid as a standard material, it was found to be 61.47±1.57 mg GAE/g and flavonoid content in LCVC using quercetin as a standard material, it was found to be 17.43±1.11 mg QE/g (Table 3).
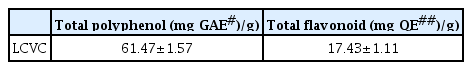
Total Polyphenol and Flavonoid Contents of LCVC
2. The antioxidant activity of LCVC
1) DPPH and ABTS radical scavenging activity
As a result of measuring the DPPH and ABTS radical scavenging ability according to the treatment of LCVC, the scavenging ability of LCVC was increased concentration-dependently (Table 4).
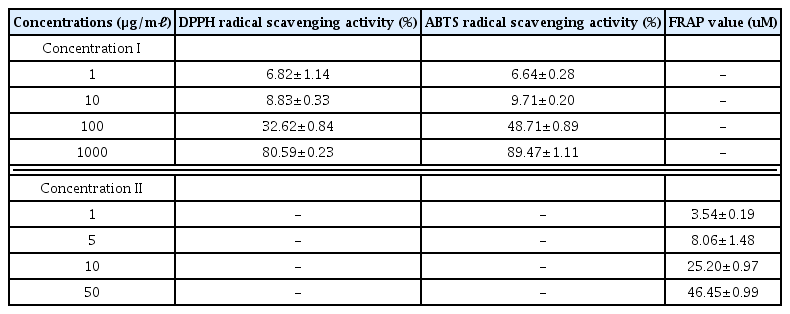
DPPH, ABTS Radical Scavenging Activity and FRAP Value of LCVC
2) FRAP activation
As a result of measuring FRAP activity, FRAP activity of LCVC was increased concentration-dependently (Table 4).
3. Cytotoxicity
As a result of measuring cell viability, LCVC showed a concentration-dependent cell proliferation at a concentration of 50 μg/ml or higher, and showed a cell viability of less than 90% at a concentration of 400 μg/ml or higher (Table 5)
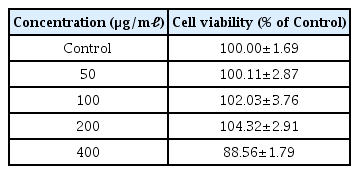
Cell viability of LCVC in RAW264.7 Cell
4. Effects on production of ROS
When the concentration of LCVC was 50 μ g/ml or higher, the amount of ROS production decreased significantly (*: p<0.05, **: p<0.01, ***: p<0.001) compared to the control group (Table 6).
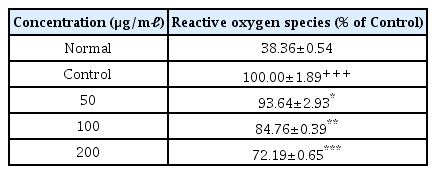
Effect of LCVC on ROS Level in RAW264.7 cell
5. Effects on production of NO
When the concentration of LCVC was 50 μ g/ml or higher, the amount of NO production decreased significantly (*: p<0.05, **: p<0.01, ***: p<0.001) compared to the control group (Table 7).
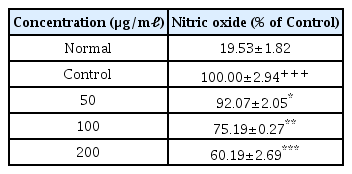
Effect of LCVC on NO Level in RAW264.7 cell
6. Effects on pro-inflammatory cytokine production
When the concentration of LCVC was 100 μ g/ml or higher, the amount of PGE2 and IL-1β production decreased significantly (** : p<0.01, *** : p<0.001) compared to the control group (Table 8). When the concentration of LCVC was 50 μg/ml or higher, the amount of IL-6 and TNF-α production decreased significantly (* : p<0.05, ** : p<0.01, *** : p<0.001) compared to the control (Table 8).
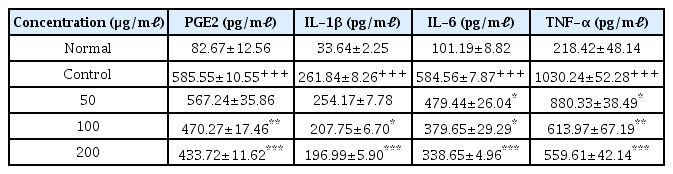
Effect of LCVC on Level of pro-inflammatory cytokines in RAW264.7 cell
7. Effects on Gene expression
When the concentration of LCVC was 100 μ g/ml or higher, gene expression level of iNOS and COX-2 were significantly decreased (** : p <0.01, *** : p<0.001) compared to the control group (Table 9). When the LCVC concentration was 50 μg/ml or higher, the gene expression level of IL-1β, IL-6 and TNF-α were significantly decreased (* : p<0.05, ** : p<0.01, *** : p<0.001) compared to the control group (Table 9). When the concentration of LCVC was 100 μg/ml or higher, the gene expression level of the Nrf2 was significantly increased (** : p<0.01, *** : p<0.001) compared to the normal group (Table 9). When the concentration of LCVC was 50 μg/ml or higher, the Keap1 gene expression level was significantly reduced (* : p<0.05, ** : p<0.01, *** : p<0.001) compared to the normal group (Table 9). When the concentration of LCVC was 100 μg/ml or higher, the HO-1 gene expression level increased significantly (***: p<0.001) compared to the normal group (Table 9). When the LCVC concentration was 50 μg/ml or higher, the expression level of the NQO1 gene was significantly increased (** : p<0.01, *** : p <0.001) compared to the normal group (Table 9).
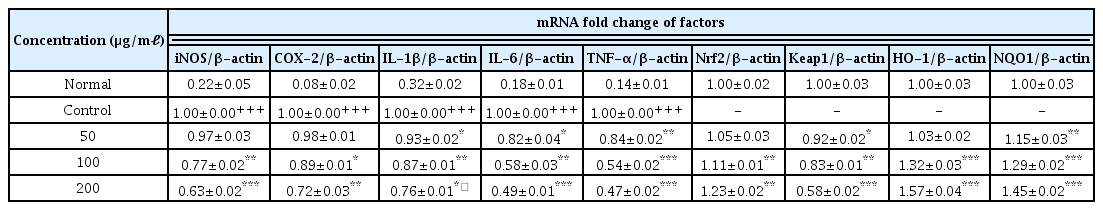
Effect of LCVC on mRNA Expression Level of pro-inflammatory cytokines in RAW 264.7 cell
8. Effects on protein expression
No change in protein expression level of ERK, P38 was found according to the concentration of LCVC, and no significance was observed (Table 10)(Fig. 1,3). When the concentration of LCVC was 50 μg/ml or higher, the expression level of JNK protein decreased significantly (** : p<0.01, *** : p<0.001) compared to the control group (Table 10)(Fig. 2). When the concentration of LCVC was 100 μg/ml or higher, the protein expression level of Nrf2 and HO-1 increased significantly (* : p<0.05, *** : p<0.001) compared to the normal group (Table 10)(Fig. 4,6). When the LCVC concentration was 100 μg/ml or higher, the Keap1 protein expression level was significantly decreased (**p<0.01, ***p<0.001) compared to the normal group (Table 10)(Fig. 5). When the LCVC concentration was 50 μg/ml or higher, the expression level of NQO1 protein increased significantly (***p<0.001) compared to the normal group (Table 10)(Fig. 7).
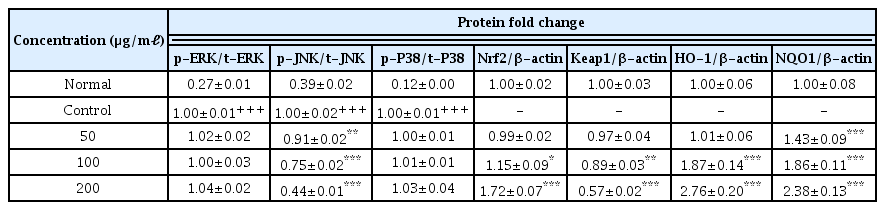
Effect of LCVC on Protein Expression Level of pro-inflammatory cytokines in RAW 264.7 cell
Effect of LCVC on ERK protein expression level in RAW264.7 cell
RAW264.7 cell were treated 50, 100, and 200 μg/mℓ of LCVC with 100 ng/mℓ LPS for 24 h. The total cell extracts were analyzed via 10% SDS-PAGE and western blot analysis using respective primary and secondary antibodies. The results of the three independent experiments were described as mean ± standard deviation (Significance of results, +++ : p<0.001 compared to normal)
Effect of LCVC on p38 protein expression level in RAW264.7 cell
RAW264.7 cell were treated 50, 100, and 200 μg/mℓ of LCVC with 100 ng/mℓ LPS for 24 h. The total cell extracts were analyzed via 10% SDS-PAGE and western blot analysis using respective primary and secondary antibodies. The results of the three independent experiments were described as mean ± standard deviation (Significance of results, +++ : p<0.001 compared to control)
Effect of LCVC on JNK protein expression level in RAW264.7 cell
RAW264.7 cell were treated 50, 100, and 200 μg/mℓ of LCVC with 100 ng/mℓ LPS for 24 h. The total cell extracts were analyzed via 10% SDS-PAGE and western blot analysis using respective primary and secondary antibodies. The results of the three independent experiments were described as mean ± standard deviation (Significance of results, +++ : p<0.001 compared to normal, * : p <0.05, ** : p<0.01, *** : p<0.001 compared to control).
Effect of LCVC on Nrf2 protein expression level in RAW264.7 cell
RAW264.7 cell were treated 50, 100, and 200 μg/mℓ of LCVC with 100 ng/mℓ LPS for 24 h. The total cell extracts were analyzed via 10% SDS-PAGE and western blot analysis using respective primary and secondary antibodies. The results of the three independent experiments were described as mean ± standard deviation (Significance of results, * : p<0.05, ** : p<0.01, *** : p<0.001 compared to normal).

Effect of LCVC on HO-1 protein expression level in RAW264.7 cell
RAW264.7 cell were treated 50, 100, and 200 μg/mℓ of LCVC with 100 ng/mℓ LPS for 24 h. The total cell extracts were analyzed via 10% SDS-PAGE and western blot analysis using respective primary and secondary antibodies. The results of the three independent experiments were described as mean ± standard deviation (Significance of results, * : p<0.05, ** : p<0.01, *** : p<0.001 compared to normal).
Effect of LCVC on Keap1 protein expression level in RAW264.7 cell
RAW264.7 cell were treated 50, 100, and 200 μg/mℓ of LCVC with 100 ng/mℓ LPS for 24 h. The total cell extracts were analyzed via 10% SDS-PAGE and western blot analysis using respective primary and secondary antibodies. The results of the three independent experiments were described as mean ± standard deviation (Significance of results, * : p<0.05, ** : p<0.01, *** : p<0.001 compared to normal).
Effect of LCVC on NQO1 protein expression level in RAW264.7 cell
RAW264.7 cell were treated 50, 100, and 200 μg/mℓ of LCVC with 100 ng/mℓ LPS for 24 h. The total cell extracts were analyzed via 10% SDS-PAGE and western blot analysis using respective primary and secondary antibodies. The results of the three independent experiments were described as mean ± standard deviation (Significance of results, * : p<0.05, ** : p<0.01, *** : p<0.001 compared to normal).
Discussion
Existing anti-inflammatory agents used for the treatment of inflammatory diseases can cause side effects such as gastrointestinal disorders, renal function deterioration, and cardiovascular disorders when taken for a long period of time. Therefore, research is underway to develop anti-inflammatory agents extracted from natural resources that can minimize these side effects21). Similarly, chemically synthesized single-component antioxidants previously listed may have side effects due to administration of high-concentration components to the human body22). Natural substances extracted from plants showed antioxidant and anti-inflammatory effects, and it was reported that low-concentration components are absorbed while being friendly to the human body, resulting in fewer side effects23).
The Lonicerae Flos is a dried flower bud or freshly blooming flower of Lonicera japonica Thunb of the Caprifoliaceae family. It is reported to be used in the treatment of inflammatory diseases such as upper respiratory tract infections such as otitis media, tonsillitis, laryngitis, cutaneous suppuration, viral conjunctivitis, influenza, pneumonia, purulent infections18,24). The Violae Herba is a dried perennial herb belonging to the Violinaceae family, Violet, and the close root of its close relatives, and contains salicylic acid, glycosides, alkaloids, flavonoids, and various types of saponins16). It has been reported to be effective in inflammatory diseases such as rheumatoid arthritis and atopic dermatitis16,17). The Citri Pericarpium is the dried peel of the mature tangerine fruit of the tangerine tree, an evergreen small tree belonging to the Unhyeongdae family, and is used as a rich resource for inducing natural flavonoids25). It contains various components such as vitamin C, folic acid, pectin and terpenes, dietary fiber, carotenoids, and flavonoids. Among them, the main compounds of citrus flavonoids include flavanones, naringin and hesperidin, and their non-glycoside forms, naringenin and hesperetin. It has Antibacterial, antioxidant, anticancer, anti-inflammatory, and anti-obesity effects19). Through the above effects, it has been reported that it is used in various diseases such as asthma, viral hepatitis, alcoholic liver disease, obesity, high blood pressure, and arteriosclerosis26). Therefore, in this study, antioxidant and anti-inflammatory effects were confirmed by measuring the antioxidant content, antioxidant function evaluation, biomarker production amount, gene expression level, and protein expression level of LCVC.
Various studies related to inflammation, such as inhibition of inflammatory mediators, inflammatory cytokines, and inflammatory signaling pathways, are being conducted. LPS-treated RAW 264.7 macrophages model was mostly used to demonstrate these kinds of experiments. Adequate oxidative stress is a fundamentally necessary function for maintaining intracellular homeostasis, but abnormally excessive oxidative stress is closely related to the pathological condition of various chronic inflammatory diseases27). Since antioxidants play an important role in controlling inflammation that occurs in chronic diseases28), various experiments were conducted to specifically demonstrate antioxidant efficacy. As a result, it was confirmed that LCVC contains polyphenols and flavonoids, which are known to act as antioxidants in vivo (Table 3), and DPPH radical scavenging activity, ABTS radical scavenging activity, FRAP activity corresponding to the measurement methods of antioxidant efficacy showed good results. Overall, it was confirmed that LCVC had an antioxidant effect (Table 4).
Cell viability was measured to establish an appropriate concentration range. LCVC was not toxic when the concentration was 50, 100, or 200 μg/ml compared to the control group. Experiment was conducted based on the above concentration (Table 5).
ROS overexpresses inflammation-related genes to amplify the inflammatory signal of macrophages, and moves these macrophages and additional neutrophils to the site of inflammation to additionally secrete inflammatory mediators and cytokines29,30). In other words, the regulation of ROS is also an important indicator to control inflammation. In order to check the level of intracellular ROS, which is a strong potential factor that induces inflammation, the change in ROS production after LCVC treatment was measured. The result showed that the level of ROS were significantly decreased which means LCVC has antioxidant effect (Table 6).
NO, one of the major inflammatory mediators, is a by-product of the metabolic process in which L-arginine is converted to L-citrulline through Nitric Oxide Synthase (NOS)31). NOS is divided into three types: neuronal NOS (nNOS), inducible NOS (iNOS), and endothelial NOS (eNOS). PGE2 is involved in a variety of bodily functions to maintain homeostasis32), and under normal circumstances, it plays an essential role in repairing damaged tissues and improving the human’s ability to recover1). However, excessive production of inflammatory mediators accelerates the inflammatory response, leading to the onset and progression of various inflammatory diseases such as rheumatoid arthritis and multiple sclerosis29). As a result of the experiment, the NO level was significantly decreased at all concentrations of LCVC, and the PGE2 level was significantly decreased at all concentrations except 50 μg/ml (Table 7,8). iNOS is involved in the production of NO and COX-2 in the production of PGE2. The result of measuring the gene expression levels of iNOS and COX-2 was significantly reduced at all concentrations except 50 μg/ml amount of LCVC (Table 8). It means that LCVC reduced inflammatory mediators such as NO and PGE2 by controlling the expression of genes such as iNOS and COX-2 at the transcriptional stage. The inhibition of the production of Inflammatory mediators such as NO and PGE2, and the inhibition of iNOS and COX-2 gene expression play an important role in the treatment of inflammatory diseases. The results shows that LCVC has potential to be the key to treat with those diseases.
The inflammatory cytokines such as IL-1β and IL-6 TNF-α increase the expression of iNOS and COX-2. These markers significantly increase the production of NO and PGE233). It means that Inhibiting the production of inflammatory cytokines is an important function in regulating inflammatory mediators. As a result of measuring the production amount following LCVC treatment, IL-1β was significantly decreased at all concentrations except 50 μg/ml, IL-6, TNF-α level was significantly decreased at all concentrations (Table 8). The expression level of the corresponding gene was also significantly decreased concentration dependently by treatment amount of LCVC (Table 9). It means that the production of inflammatory cytokines is suppressed by decreased genetic expression.
Nrf2 is a primary transcription factor in response to oxidative stress and plays an important role in maintaining intracellular homeostasis through physiological defense mechanisms against various inflammatory and oxidative stimuli34). Under normal oxidation-reduction conditions, Nrf2 exists in the cytoplasm in a state of binding to the inhibitory protein Keap1. When activated by an external stimulus or oxidative stress, it is separated from the Keap1 protein and migrates to the nucleus. In the nucleus, Nrf2 binds to the antioxidant response element (ARE) in a dimer state with the small maf protein and promotes the expression of antioxidant genes. Also, it controls the expression of antioxidant proteins such as HO-1 and decrease macrophage M1 phenotype and ROS to protect the body from oxidative stress from damage and infection35). HO-1 decomposes heme into iron, carbon monoxide and biliverdin. Among those, biliverdin is converted to bilirubin by biliverdin reductase, which becomes a powerful antioxidant36). HO-1 and NQO1 are a representative target gene of Nrf2 which suppresses excessive secretion of TNF and IL by controlling Nrf2 pathway. It has anti-inflammatory effects against oxidative stress37). To aknowledge whether the anti-inflammatory response of LCVC is related to the activation of the Nrf2/HO-1 signaling pathway, we observed whether the expression of Nrf2, Keap1, HO-1, and NQO1 was changed according to the amount of LCVC treatment. As a result, Nrf2 and HO-1 were significantly increased at all concentrations except 50 μg/ml, Keap1 expression significantly decreased at all concentrations, and NQO1 increased at all concentrations (Table 9). Similarly, as a result of measuring the protein expression levels of the above indicators, Nrf2 and HO-1 showed a significant increase at all concentrations except 50 μg/ml, and Keap1 showed a decrease, and NQO1 showed a significant increase at all concentrations, showing the same trend (Table 10). It means that the effect of blocking the inflammatory response of LPS through its antioxidant effect is related to the activation of the Nrf2/Ho-1 signaling system.
The MAPKs signaling pathway induces the production of inflammatory mediators and cytokines in macrophages, and plays a key role in the activation of the ROS production stimulation pathway. MAPKs-family proteins such as ERK, JNK, and p38 stimulate TLR4 of macrophages or monocytes which are one of the cells involved in the inflammatory response in the body, to produce inflammatory mediators such as IL-1β, TNF-α, IL-6, and NO. When it functions normally, various physiological functions such as body defense, signal transduction, and vasodilation occur but if it occurs acutely or excessively, tissue damage and genetic mutation septic shock may occur6). That is, targeting the MAPKs signaling pathway can be effective therapeutic agents for inflammatory diseases by blocking various inflammatory stimulus signals. In order to confirm the effect of LCVC treatment on the activity of MAPKs family proteins induced by LPS, the expression level of ERK JNK p38 protein was checked. As a result, the expression levels of ERK and p38 had no difference with the control group, and the expression level of JNK showed a significant decreased concentration-dependently by LCVC (Table 10). It means that the anti-inflammatory effect of LCVC is related with the regulation of the MAPKs signaling system.
In this study, by checking the level of biomarker production, gene expression, and protein expression, it was confirmed that Lonicerae Flos, Citri Pericarpium, and Violae Herba Complex (LCVC) have anti-inflammatory and antioxidant effects through the mechanisms of suppressing the production of inflammatory mediators and cytokines. In addition, in this process, it was confirmed that the Nrf2/HO-1 signaling pathway, which is a major pathway of the anti-inflammatory mechanism, was activated, and the activation of the MAPKs signaling pathway was decreased. Considering the above experimental results, LCVC has antioxidant and anti-inflammatory effects through the regulation of multiple signal transduction pathways so it could be considered of being used in the treatment of inflammatory diseases in the future. However, this study have limitations as it was the result of cell experiment in mice, and the anlaysis has not been conducted by comparing the efficacy of individual herbs because of insufficient studies and differences in experimental methods and conditions. In the future, we are expecting for this study to be used effectively for efficacy verification by comparing the efficacy in individual herbs or combination with various herbs. Also, various anti-oxidative and anti-inflammatory studies to be conducted on herbs with Lonicerae Flos, Citri Pericarpium, and Violae Herba Complex.
Conclusion
LCVC (Lonicerae Flos, Citri Pericarpium and Violae Herba Complex) was administered to in lipopolysaccharide (LPS)-induced RAW 264.7 macrophages and the conclusions are as follows.
LCVC contains polyphenol and flavonoid, which are antioxidants. DPPH radical scavenging activity, ABTS radical scavenging activity, and FRAP activity were increased concentration-dependently.
Cell viability showed proliferation of cells concentration-dependently at a concentration of 50 μg/ml or more, and less than 90% at a concentration of 400 μg/ml or more.
ROS and NO production decreased concentration-dependently.
As for the biomarkers, IL-6 and TNF-α were significantly reduced concentration-dependently at all concentrations, and PGE2 and IL-1β at concentrations of 100 μg/ml or higher.
The gene expression levels of IL-1β, IL-6, TNF-α, and Keap1 were significantly decreased concentration-dependently at all concentrations, and NQO1 was increased. iNOS and COX-2 decreased concentration-dependently at 100 μ g/ml or higher, while Nrf2 and HO-1 increased.
Protein expression level was significantly decreased concentration-dependently at all concentrations of JNK, and NQO1 was increased. Nrf2 and HO-1 were significantly increased concentration-dependently at 100 μg/ml or higher, and Keap1 was decreased. ERK and p38 showed no significancy