Statistical Study of the Patient of Department of Acupuncture and Moxibustion at OO Korean Medicine Hospital in Daejeon:
- from September, 2019 to September, 2022 -
Article information

Abstract
Objectives
This study is designed to statistically analyze the features of patients who visited to Department of Acupuncture and Moxibustion at OO Korean Medicine Hospital for 3 years.
Methods
This study retrospectively analyzed the medical records of patients at Department of Acupuncture and Moxibustion at OO Korean Medicine Hospital using IBM SPSS ver. 27.0 for Windows.
Results
In the analysis of the total number of patients, those in their 30s accounted for the highest percentage, male patients had a higher rate.
In the analysis of KCD-8 code, spinal stenosis and fractures in areas other than the spine were the most common in the 70s and older, and cervical sprains were the most common in other.
In the analysis of the number of hospitalizations, patients classified as illness or higher age had more re-hospitalization than patients classified as injury or lower age in first-time care.
In the analysis of hospitalization duration, patients classified as illness, female or higher age had longer hospitalization duration than patients classified as accident, male or lower age in first-time care.
Conclusion
We expect that the results of this study would be used as reference materials for analyzing medical consumption condition of Department of Acupuncture and Moxibustion.
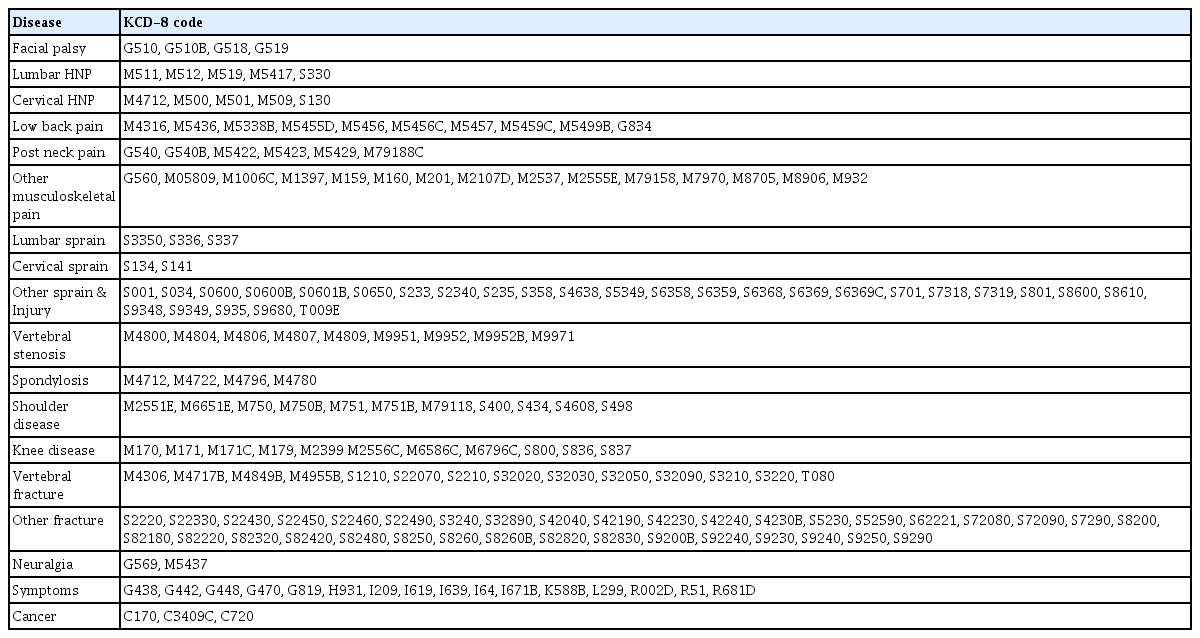
Correlation KCD-8 code for Each Disease
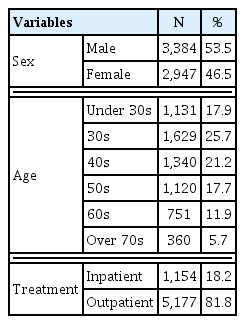
Frequency Analysis of Demographic Variables
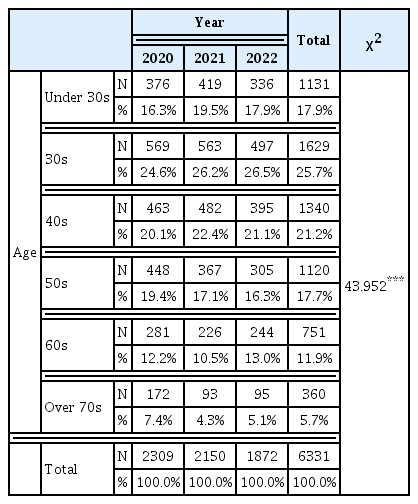
Crossover Analysis of Age and Year for Total Patients by Year
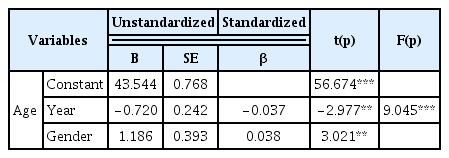
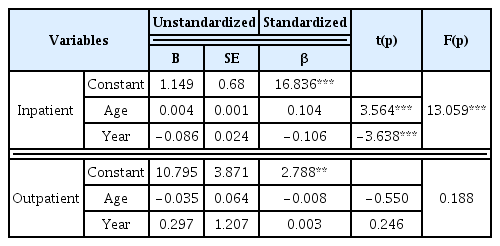
Linear Regression Analysis of Number of Patients by Age According to Year and Gender
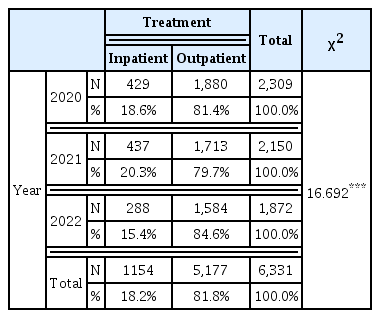
Crossover Analysis of Number of Inpatients and Outpatients by Year
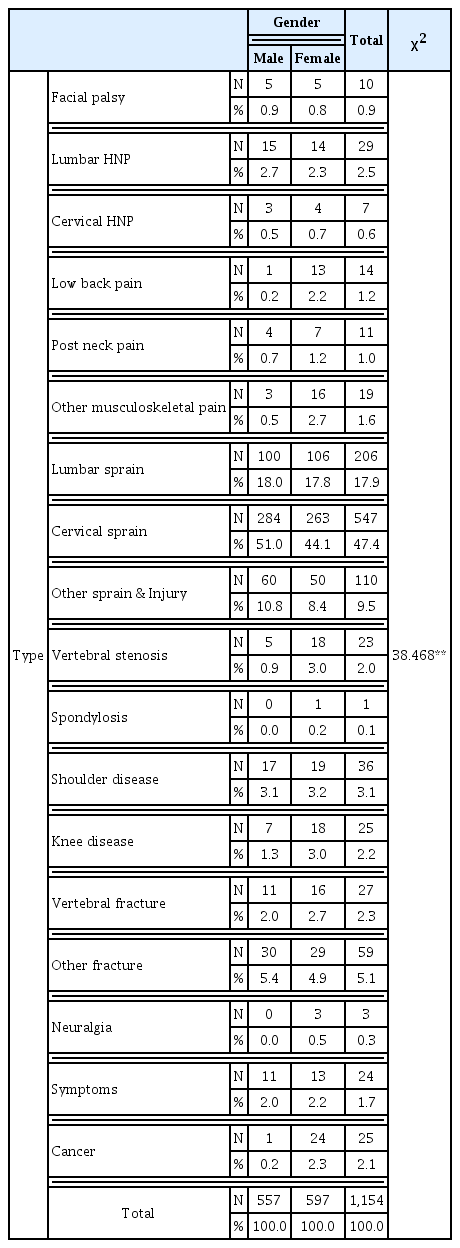
Crossover Analysis of KCD-8 Code for Inpatients by Gender
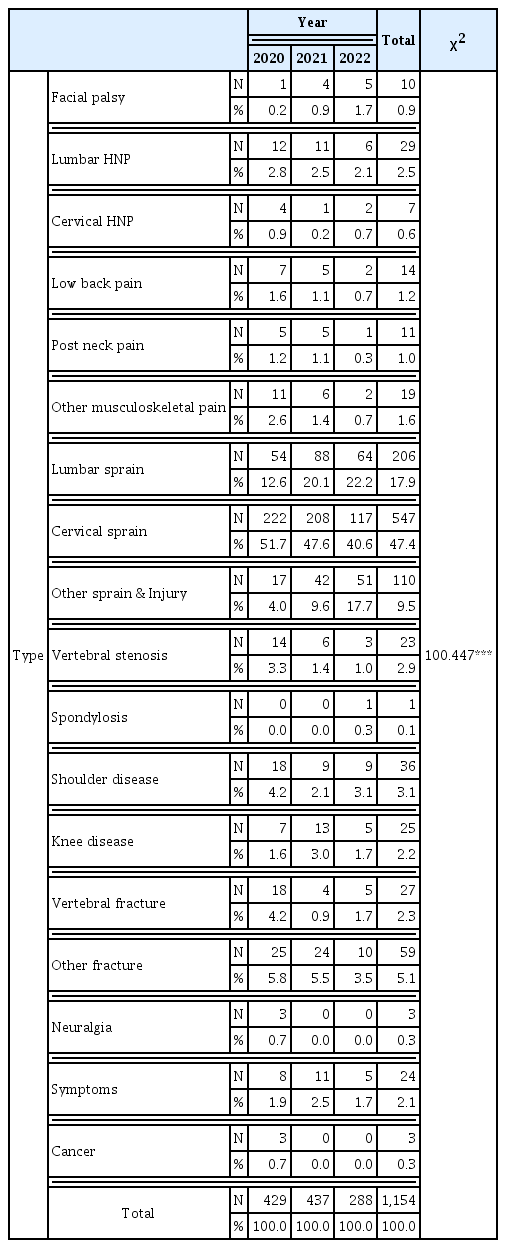
Crossover Analysis of KCD-8 Code for Inpatients by Year
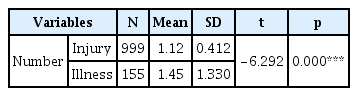
Independent T-test of Difference between KCD-8 Code and the Number of Hospitalizations
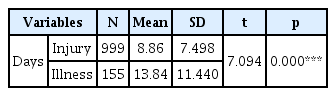
Independent T-test of Difference between KCD-8 Code and Hospitalization Duration
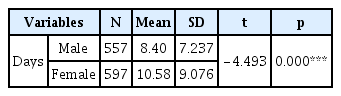
Independent T-test of Difference between Hospitalization Duration and Gender
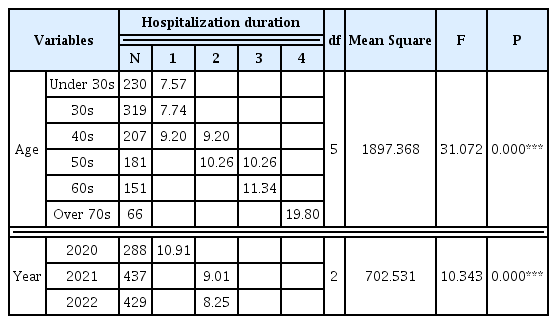
ANOVA of Age, Year, and Hospitalization Duration

Correlation Analysis of Age, Number, Duration, and Year
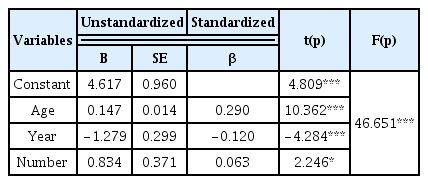
Linear Regression Analysis of Hospitalization Duration According to Age, Year, and the Number of Hospitalizations
Linear Regression Analysis of the Number of Hospitalizations According to Age and Year