Epidemiological Characteristics of COVID-19 in Chungju City from 2021 July to 2021 December
Article information

Abstract
Objectives
This study aimed to investigate the epidemiological characteristics of COVID-19 in Chungju City from July to December 2021.
Methods
The authors processed and analyzed the epidemiological analysis report written by researcher. The estimated reproduction rate was analyzed using web-based software that calculates time-varying reproduction numbers. The results were analyzed through univariate multiple regression analysis, with a maximum significance level set at 0.05.
Results
During the study period, a total of 1,188 patients were identified, with 7.9% of them progressing to a severe status. The maximum reproduction rate recorded was 3.48. Factors associated with the transition to a severe status included the presence of symptoms at the time of diagnosis, lack of vaccination, and belonging to the age group over 40.
Conclusion
Based on the findings of this study, it can be strongly supported that the measures implemented in Chungju City, such as social distancing, vaccination, and preemptive diagnostic tests, were appropriate. Furthermore, it demonstrates that Chungju City effectively managed the impact of COVID-19. Korean Medicine Doctors made significant contributions to the epidemiological investigations of COVID-19. To comprehensively manage infectious diseases, it is crucial to provide administrative and legal support and encourage active research to expand the role of Korean Medicine Doctors in this area.
Number of COVID-19 patients and estimated reproductive number of COVID-19 in Chungju City
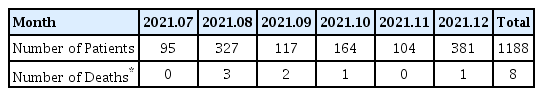
Numbers of COVID-19 Patients by Monthly from 2021 July to 2021 December
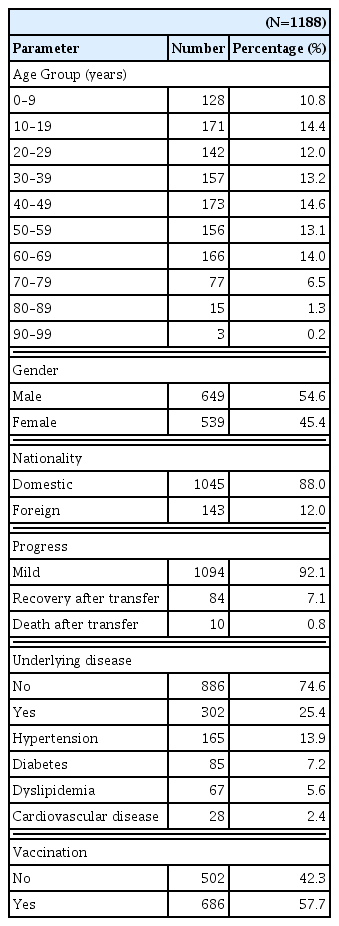
Demographic Characteristic of COVID-19 Patients in Chungju City from 2021 July to 2021 December

Characteristics of Patients with Disease Progression

Association between disease progression and prognostic factor of COVID-19 via Multiple Linear Regression Analysis
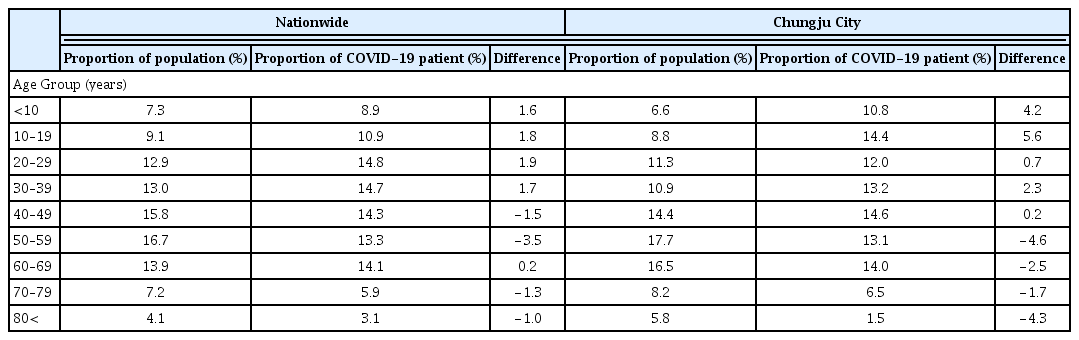
Proportion of Population and COVID-19 Patient