Cold sensitivity classification using facial image based on convolutional neural network
Article information

Abstract
Objectives
Facial diagnosis is an important part of clinical diagnosis in traditional East Asian Medicine. In this paper, we proposed a model to quantitatively classify cold sensitivity using a fully automated facial image analysis system.
Methods
We investigated cold sensitivity in 452 subjects. Cold sensitivity was determined using a questionnaire and the Cold Pattern Score (CPS) was used for analysis. Subjects with a CPS score below the first quartile (low CPS group) belonged to the cold non-sensitivity group, and subjects with a CPS score above the third quartile (high CPS group) belonged to the cold sensitivity group. After splitting the facial images into train/validation/test sets, the train and validation set were input into a convolutional neural network to learn the model, and then the classification accuracy was calculated for the test set.
Results
The classification accuracy of the low CPS group and high CPS group using facial images in all subjects was 76.17%. The classification accuracy by sex was 69.91% for female and 62.86% for male. It is presumed that the deep learning model used facial color or facial shape to classify the low CPS group and the high CPS group, but it is difficult to specifically determine which feature was more important.
Conclusions
The experimental results of this study showed that the low CPS group and the high CPS group can be classified with a modest level of accuracy using only facial images. There was a need to develop more advanced models to increase classification accuracy.
Introduction
In Korean medicine, pattern identification is the act of diagnosing and evaluating a patient’s symptoms, signs, causes and characteristics of the disease by comprehensively analyzing them, and is mainly used to determine medical treatment methods. Therefore, sophisticated dialectical diagnosis contributes to improving treatment effectiveness1,2). In particular, cold-heat pattern identification is the most basic of the Eight Principles pattern identification in Korean medicine, and can be characterized not only by the patient’s body temperature, but also by a pale complexion, a large amount of clear urine, and lack of thirst2,3). It is also known to be related to female3), low BMI4,5), low metabolic rate5), low thyroid function6), and autonomic nervous system abnormalities7). Additionally, several recent studies have reported that people with cold syndrome have more symptoms or diseases such as Mibyeong8), indigestion9), chronic rhinitis10), shoulder stiffness11), and breast cancer12) than those without cold syndrome.
Facial diagnosis is an important diagnostic method that has been used by many practitioners within and outside of traditional East Asian Medicine (TEAM)13). The face is a good indicator of overall health and well-being as it reflects the symptoms, causes, and origins of disease. Facial diagnosis has traditionally relied on subjective observations and is therefore influenced by the practitioner’s experience and personal knowledge. Therefore, several studies have tried to develop objective and reliable computer-assisted systems for facial analysis and diagnosis of patients13–18). The association of quantified facial color with blood test parameters, health status and TEAM patterns has also been widely investigated17,19–21).
Existing studies22–24) report that complexion or facial characteristics are related to cold sensitivity. Seo et al.22) reported that individuals with a cold pattern tend to have pale or white facial color on the forehead, cheeks, and nose. Additionally, Mun et al.23) reported that individuals with increased cold patterns tended to have pallor across the face. Ahn et al.24) reported that people with higher cold sensitivity tend to have a more pointed chin, longer face, more angular jaw, higher eyes, and more upward corners of the mouth.
In this study, we show that a fully automated face analysis system can be used to classify cold sensitive group and cold non-sensitive group using facial images. Specifically, the face region is cropped from the face image. The cropped facial images of the cold sensitive group and cold non-sensitive group are split into train/validation/test sets, and then this dataset is input to a convolutional neural network (CNN) to perform classification. To the best of our knowledge, this study is the first attempt to perform cold sensitivity classification using facial images based on deep learning.
Methods
1. Participants
This cross-sectional study was conducted using medical data of 452 Korean participants collected from two medical institutions from October 2015 to December 2015. These data were stored at the Korean Medicine Data Center (KDC)25) (Figure 1). Subjects aged 30 to 49 years, with a body mass index (BMI) of 15.7 to 34.1 kg/m2 and without severe fatigue or pain, who were not currently receiving treatment for a disease, participated in this study. These subjects were recruited for three studies on past persistent or recurrent fatigue (40 patients), neck pain (372 patients), and sleep problems (40 patients). The hospital’s institutional review board approved the study protocol (KHNMCIH 2014-09-010), and informed consent was obtained from all participants before inclusion in the study.
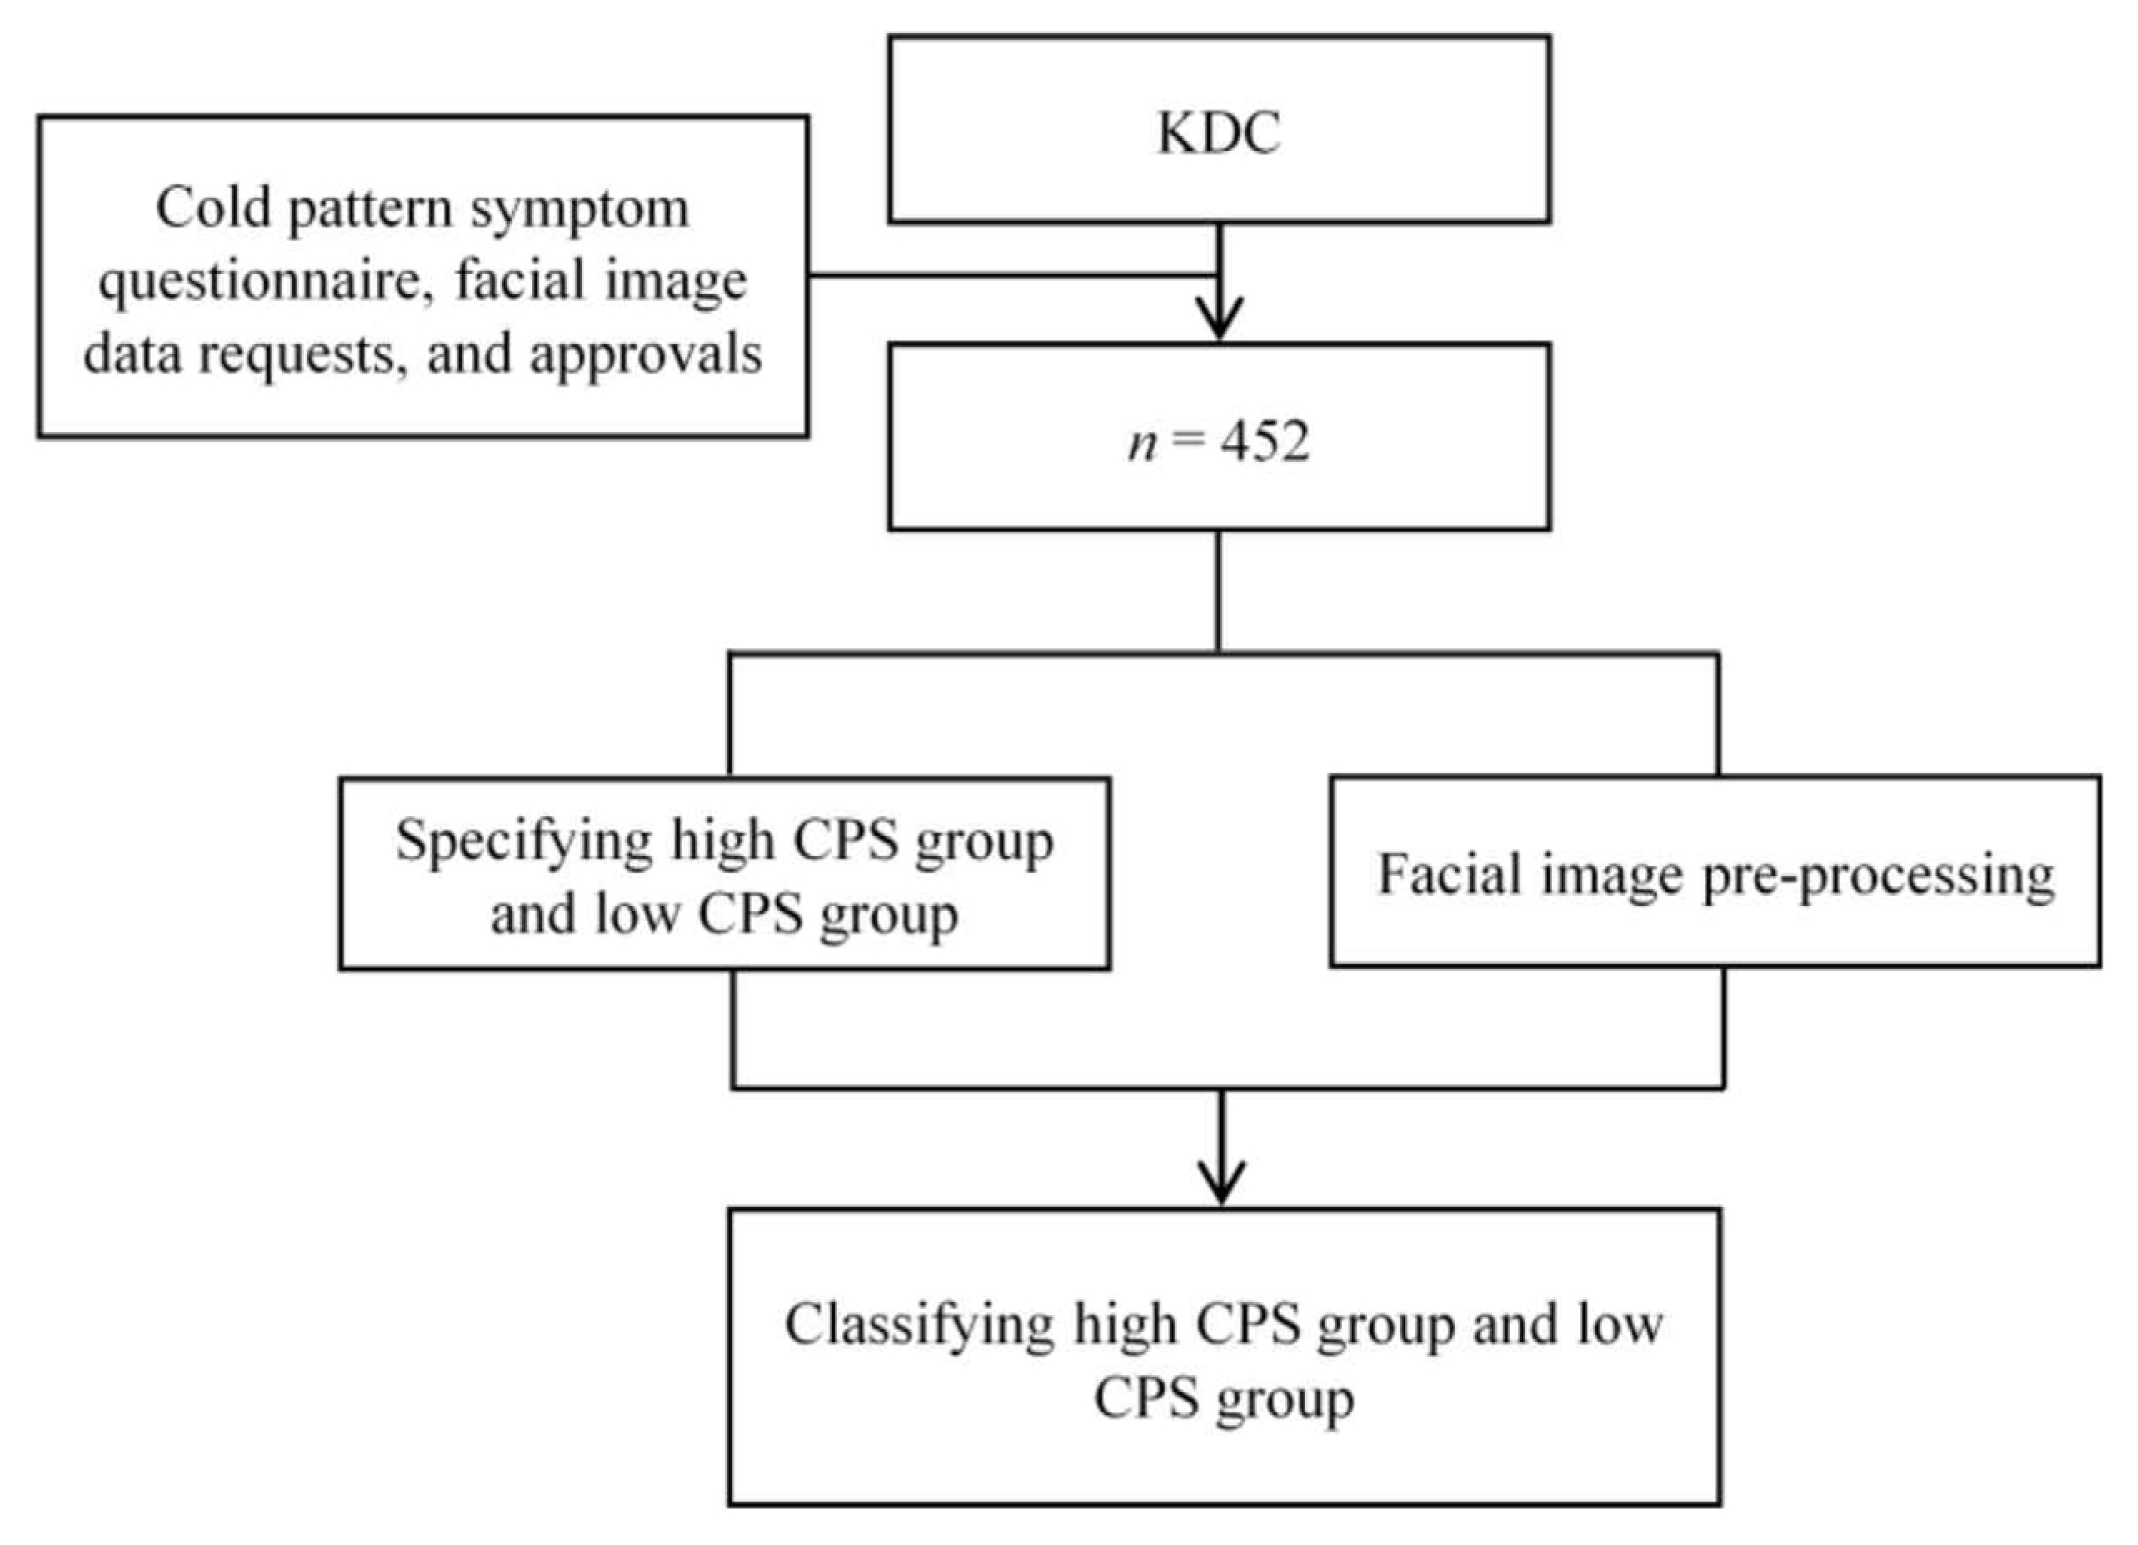
Schematic diagram of the study flow. KDC, Korean Medicine data center
2. Cold pattern
The cold pattern questionnaire consisted of eight items covering cold pattern symptoms: aversion to cold temperature, preference for warm temperature, cold abdomen, cold limbs, feeling cold in the body, pale face, preference for warm water, and clear urine. The questionnaire was self-administered and each question was rated on a 5-point scale: from ‘strongly disagree’ (1 point) to ‘strongly agree’ (5 points). The Cold Pattern Score (CPS) was calculated by summing all eight items and ranges from 8 to 40. A higher CPS score indicates greater cold sensitivity. The agreement between the two experts on this questionnaire was 87.1% (Kappa value 0.741)26).
In this study, the low CPS group (cold non-sensitive group) and the high CPS group (cold sensitive group) were defined as groups below the 1st quartile and above the 3rd quartile of CPS scores, respectively. Existing study26) suggests cut-off value for cold sensitivity, however, since this study is a challenging study that classifies cold sensitivity using only facial images, the 1st quartile and the 3rd quartile were used.
It is known that cold sensitivity varies depending on sex9,10,23,24). Therefore, additional experiments were conducted to classify the low CPS group and the high CPS group for male and female, respectively.
3. Image acquisition
Facial images were acquired using a digital camera (Nikon D5100 with 85 mm lens, Nikon Co., Ltd., Japan) equipped with a prime lens (fixed focal length lens). Prior to acquiring facial images, participants were told the purpose and process of the study. Participants were seated comfortably in a chair, and the camera was fixed on a tripod at a distance of 1.6 m from the subject. Subject were asked to wear a hairband so that their forehead and ears were exposed. To reduce inter-rater bias, we established a strict standard operating procedure (SOP) for photography. If the operator was unable to obtain a certain level of images, the images were acquired again until a certain level of images were taken. Facial images were acquired using an external fluorescent light source at the same location and saved in jpeg format with a resolution of 3696 × 2448 pixels.
4. Classifying high CPS group and low CPS group using facial images
1) Image pre-processing
A digital color image consists of three channels of red, green, and blue, the three primary colors of light, and each channel data ranges from 0 to 255. For CNN modeling, input data is normalized to data in the range of 0 to 1.
In order for the convolutional neural network (CNN) algorithm to recognize group differences in facial images, the facial images must be input at the similar location and size. First, facial landmarks are detected from facial images using DLib27). Affine transformation28) is applied so that the positions of the five landmarks of the face (the center of both eyes, the tip of the nose, and both ends of the lips) fit the five reference points. In other words, the affine transformation is used to induce the subject’s face images to have similar positions and sizes (see Figure 2). The example face images in this paper were from the publicly available facial image dataset29).
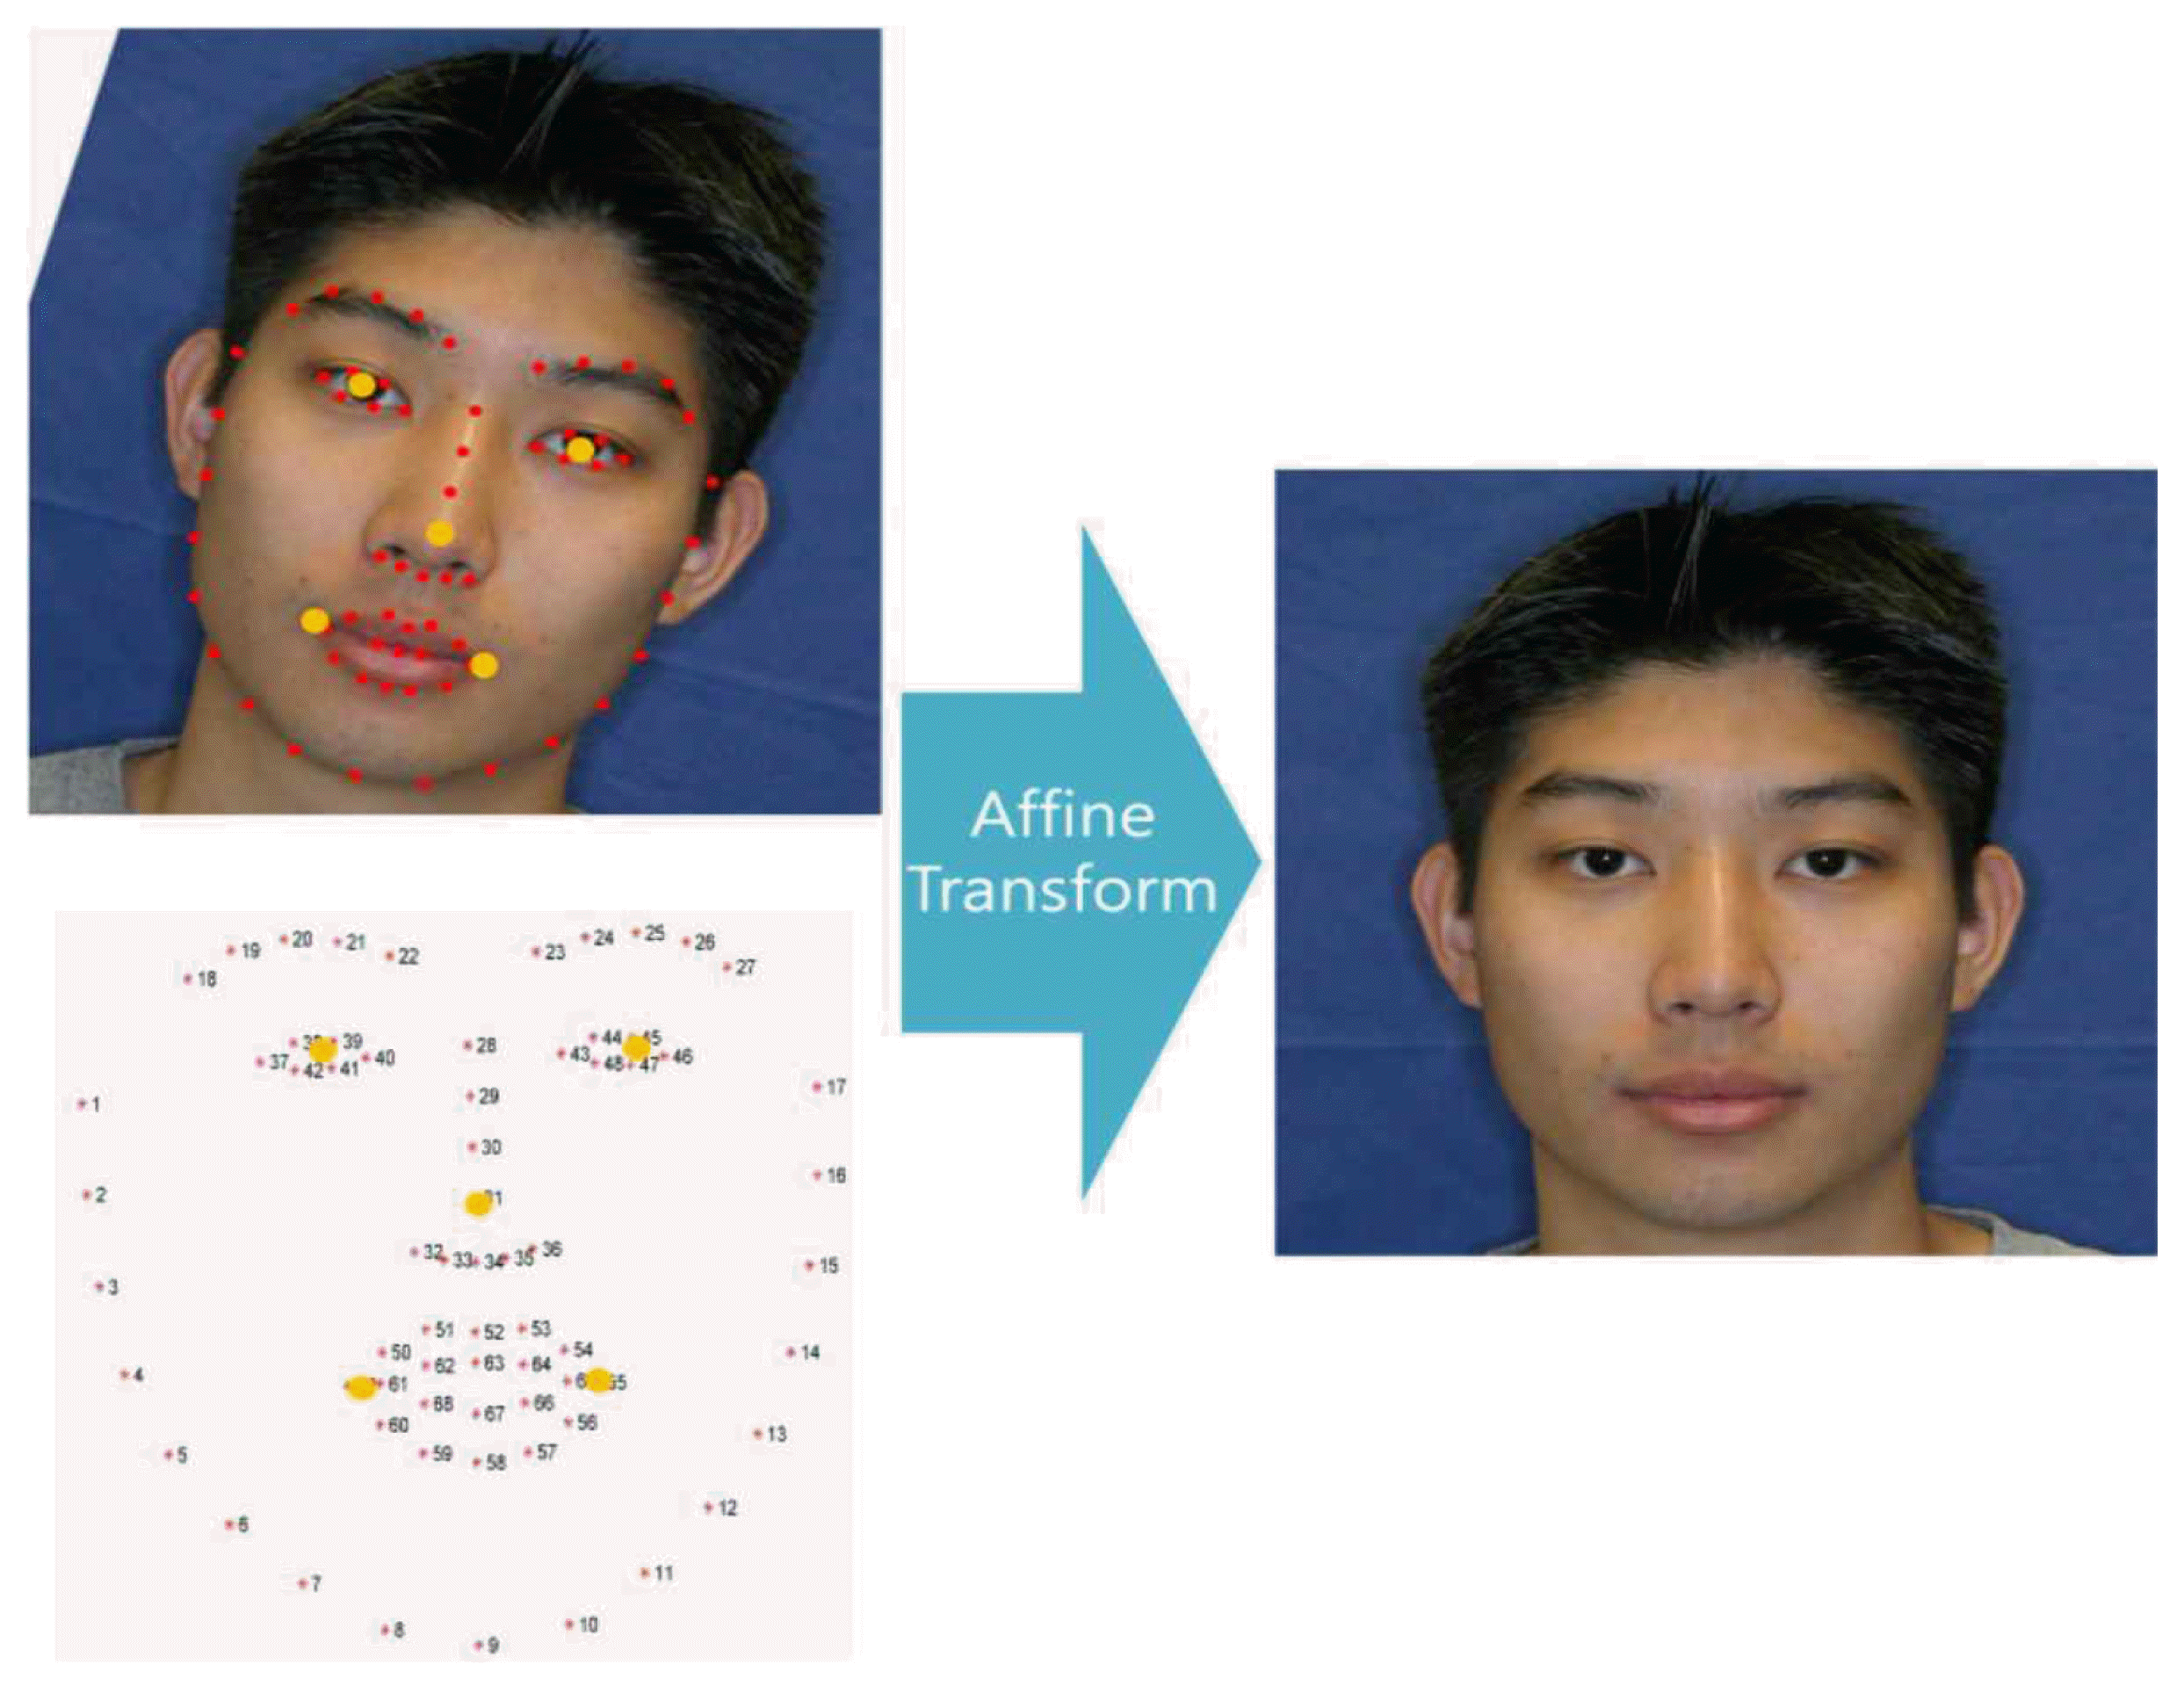
Preprocessing of face images using affine transformation. Left top: input image, Left bottom: average landmark, right: cropped face image. The original image is taken from the Chicago Face Database14), a public image database.
Deep learning model consists of many layers to improve performance. While a neural network model composed of many layers has the advantage of high performance, it has the disadvantage of encountering the overfitting problem, which shows good performance only on learned data but worsens performance on new data. The deep learning model is more likely to misclassify the input image in case a new input image has different characteristics from the existing dataset. For example, the model is more likely to misclassify the input image if a dark image is input to a model learned using a dataset consisting of bright images. A representative alternative to prevent these problems is data augmentation. Data augmentation is a technique to prevent overfitting by applying various mutations to the original data. Various mutations include horizontal flip, vertical flip, image rotation, color transform, blurring, random crop, histogram processing, and image warping. The following augmentation variants were used in this study: horizontal flip, random color, random contrast, and random brightness.
2) Image classification model
The convolution f and g is defined as the integral of the product of the two functions after one is reflected about the y-axis and shifted and is written f*g. Two-dimensional discrete convolution can be expressed as equation (1).
where f and g mean input data and filter, respectively. f(x,y) means the input image value at the x and y position on the x-axis and y-axis, and i, and j means the i-th row and j-th column. CNN applies convolution, activation function, and pooling across multiple layers.
Deep learning can process classification problems in a batch from feature extraction to classification (called end-to-end), but deep learning models require a sufficiently large amount of data. There are classification problems for which sufficient data cannot be collected, and collecting sufficient data takes a lot of budget and time. An alternative to overcome this problem is transfer learning30). Transfer learning is a technique that uses the weights of a deep learning model that has been trained on a large amount of data to fine tune the weight parameters to fit a small amount of new data. Pre-trained models frequently used in transfer learning include the following models, and these models were trained using the ImageNet dataset, which consists of a total of more than 20,000 classes and more than 14 million images: VGG, Inception, and Xception, ResNet, MobileNet, etc.30,31). In this study, transfer learning is performed using VGG16, Inception V3, and Xception models. The final classification result is derived by combining the classification results of these three models, (ensemble classifier); VGG16, Inception V3 and Xception (see Figure 3).
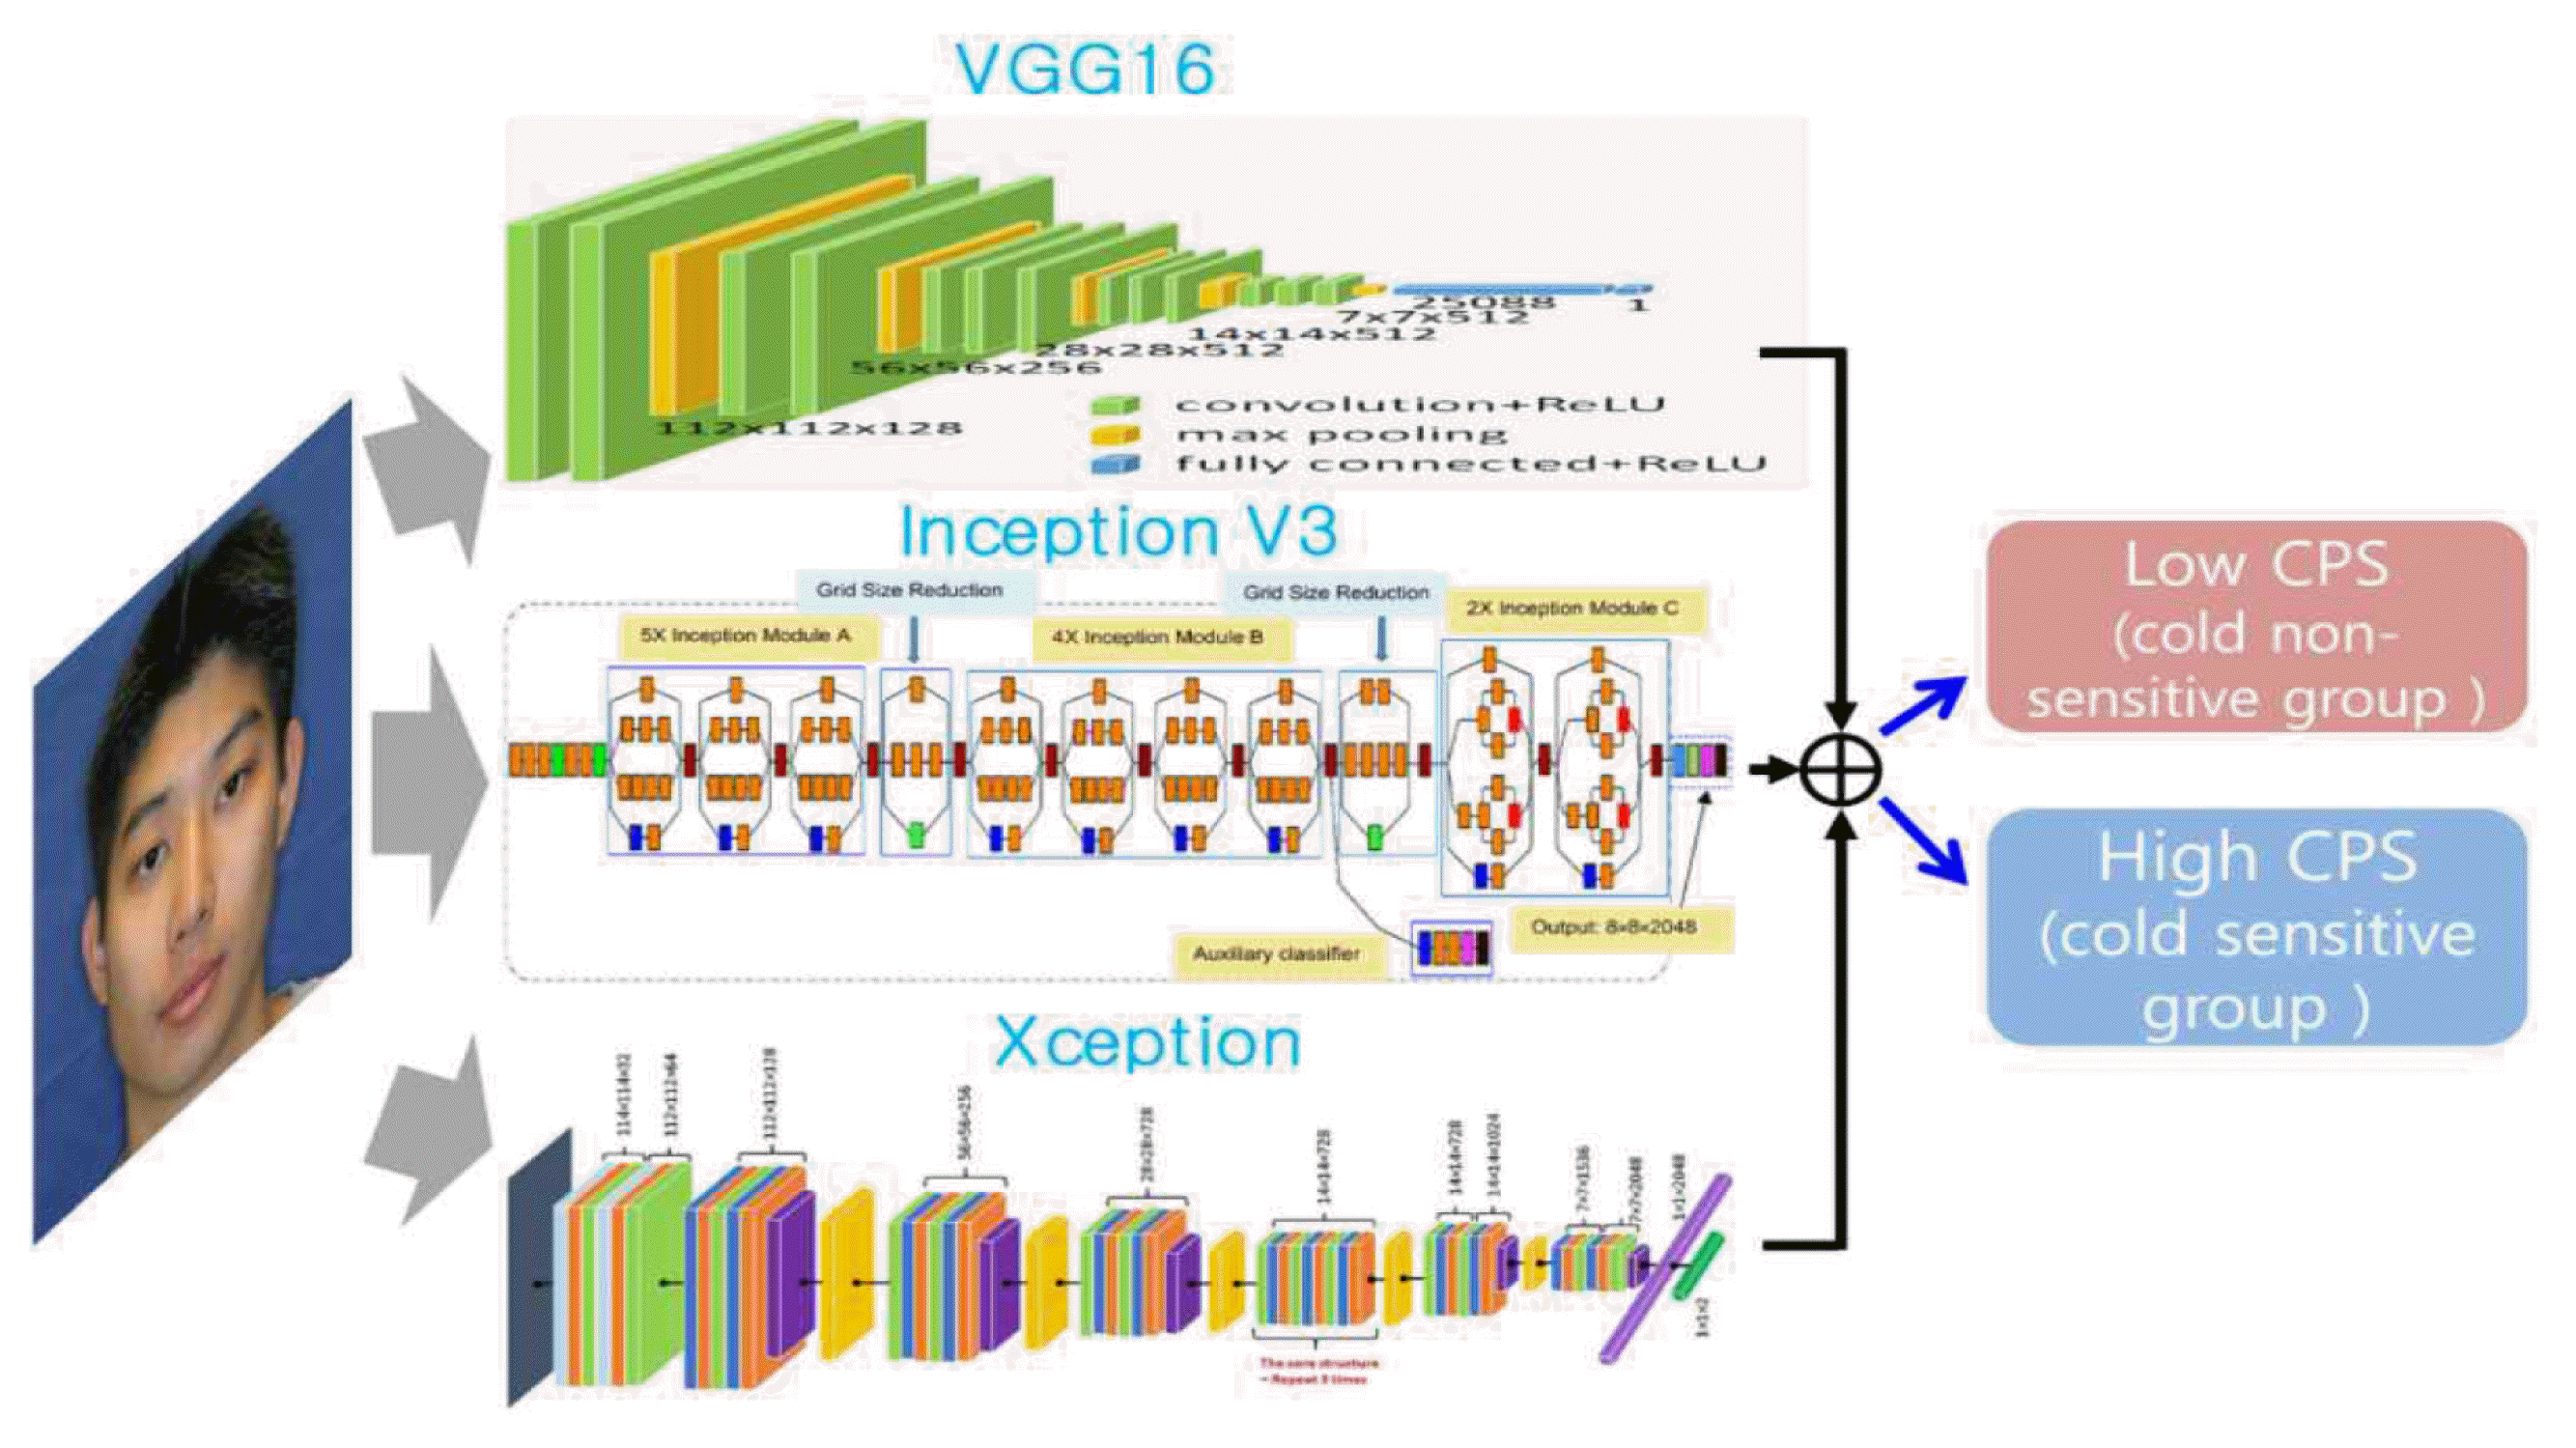
The cold sensitive group (high CPS) and the cold non-sensitive group (low CPS) classification using transfer learning
3) Test Time Augmentation
Data augmentation techniques are performed on the train set in most cases to prevent overfitting problems. On the other hand, Test Time Augmentation (TTA)32) is a technique to improve classification performance by applying augmentation techniques to the test set. After performing various mutations on the test set image, the mutated images are input to the learned model to derive classification probabilities. These probabilities are averaged to derive the final classification result. In this study, left-right flip, rotate, random zoom, random distortion, random color, random contrast, and random illuminance, random brightness, random erasing were applied to the test set images (see Figure 4).
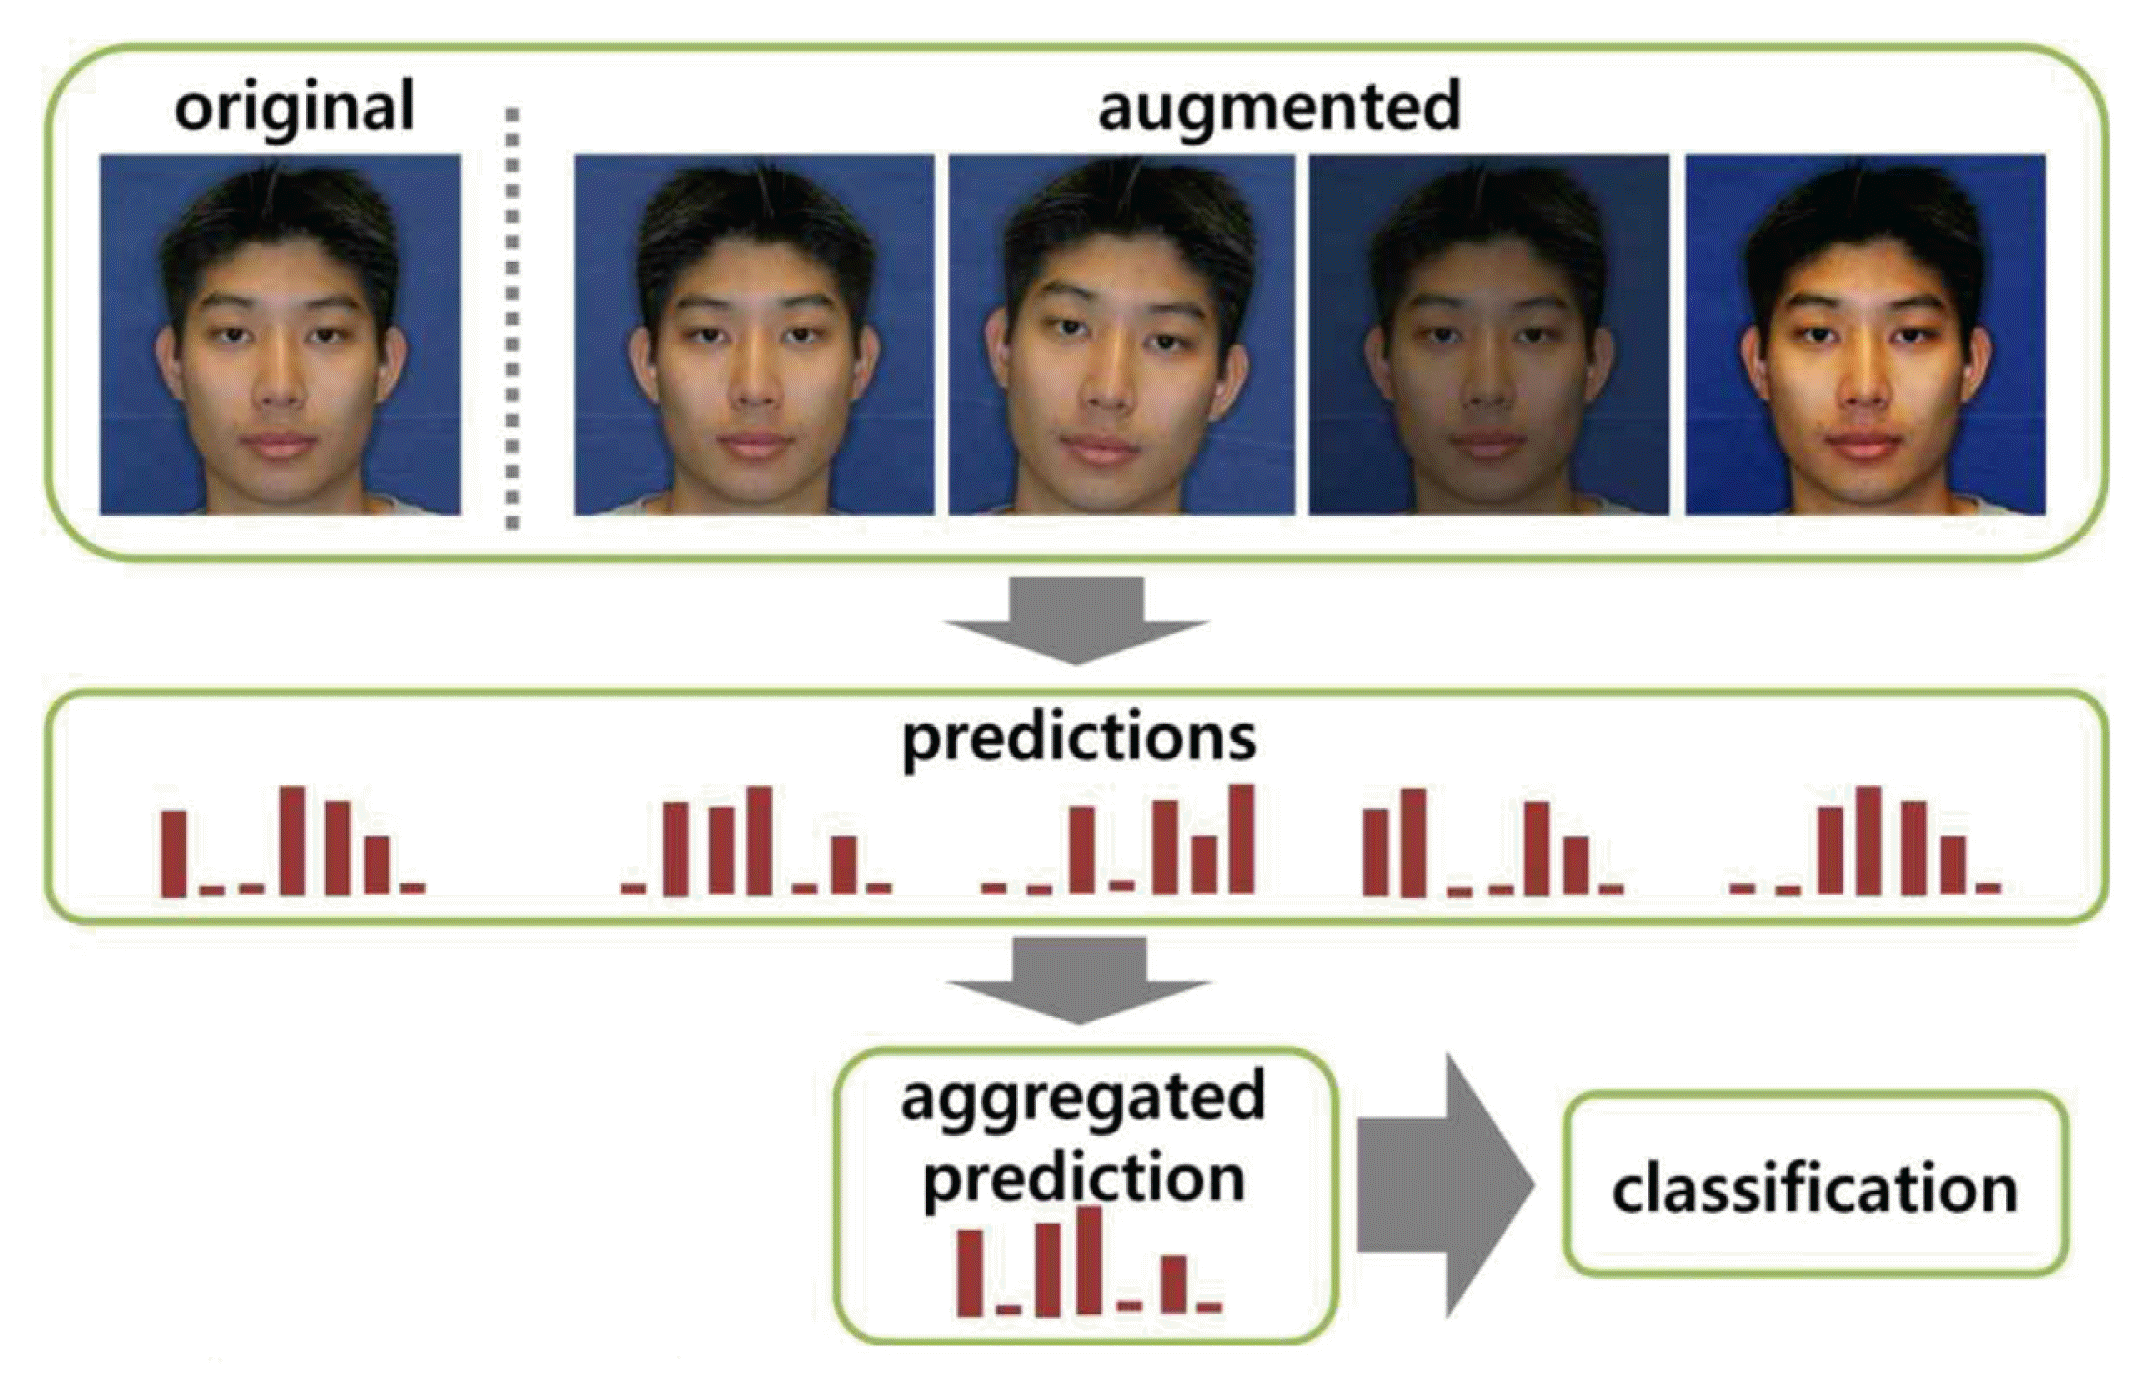
Test-Time Augmentation to improve predictions
Results
1. Characteristics of participants
A total of 452 subjects participated in this study, with an average age of 39.5 ± 3.4 years (range: 29.9 to 49.0 years), 185 men and 267 women. The average BMI was 24.6 ± 5.2 (range: 9–39) and the average CPS was 23.6 ± 3.4 (range: 15.7–34.1) (see Table 1 and Figure 5).
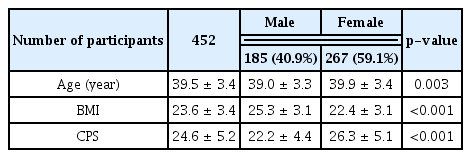
Characteristics of all Participants
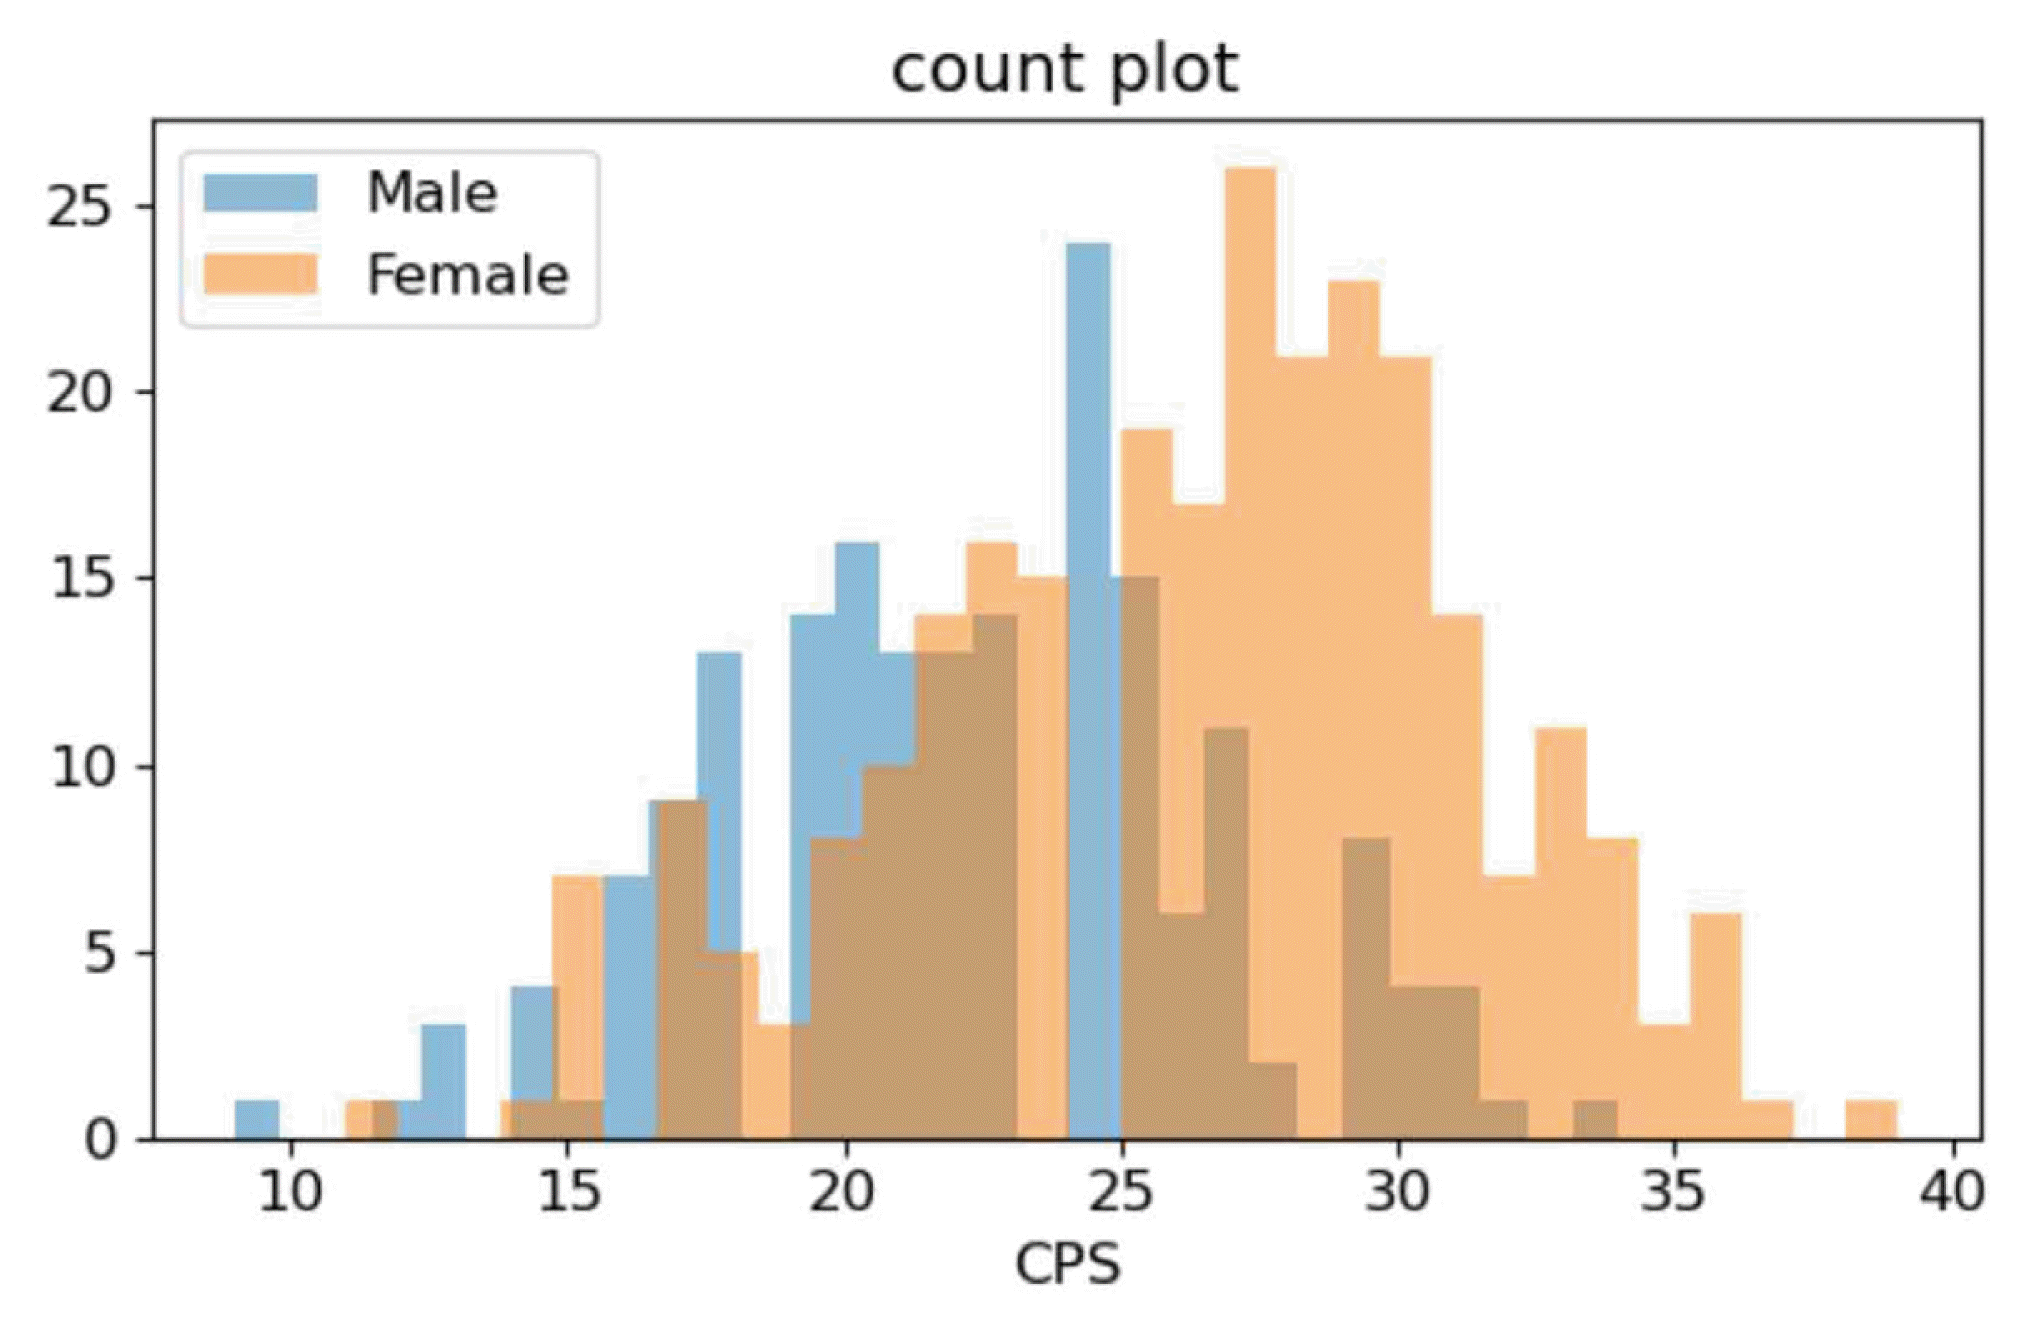
The CPS histogram of male and female participants
2. Classification result of low CPS and high CPS
To evaluate classification accuracy, stratified k-fold cross validation was performed on the entire data. Stratified k-fold cross validation splits the entire data into k-folds, and each fold contains the same proportion of classes. In this paper, k=5 was set (see Figure 6).
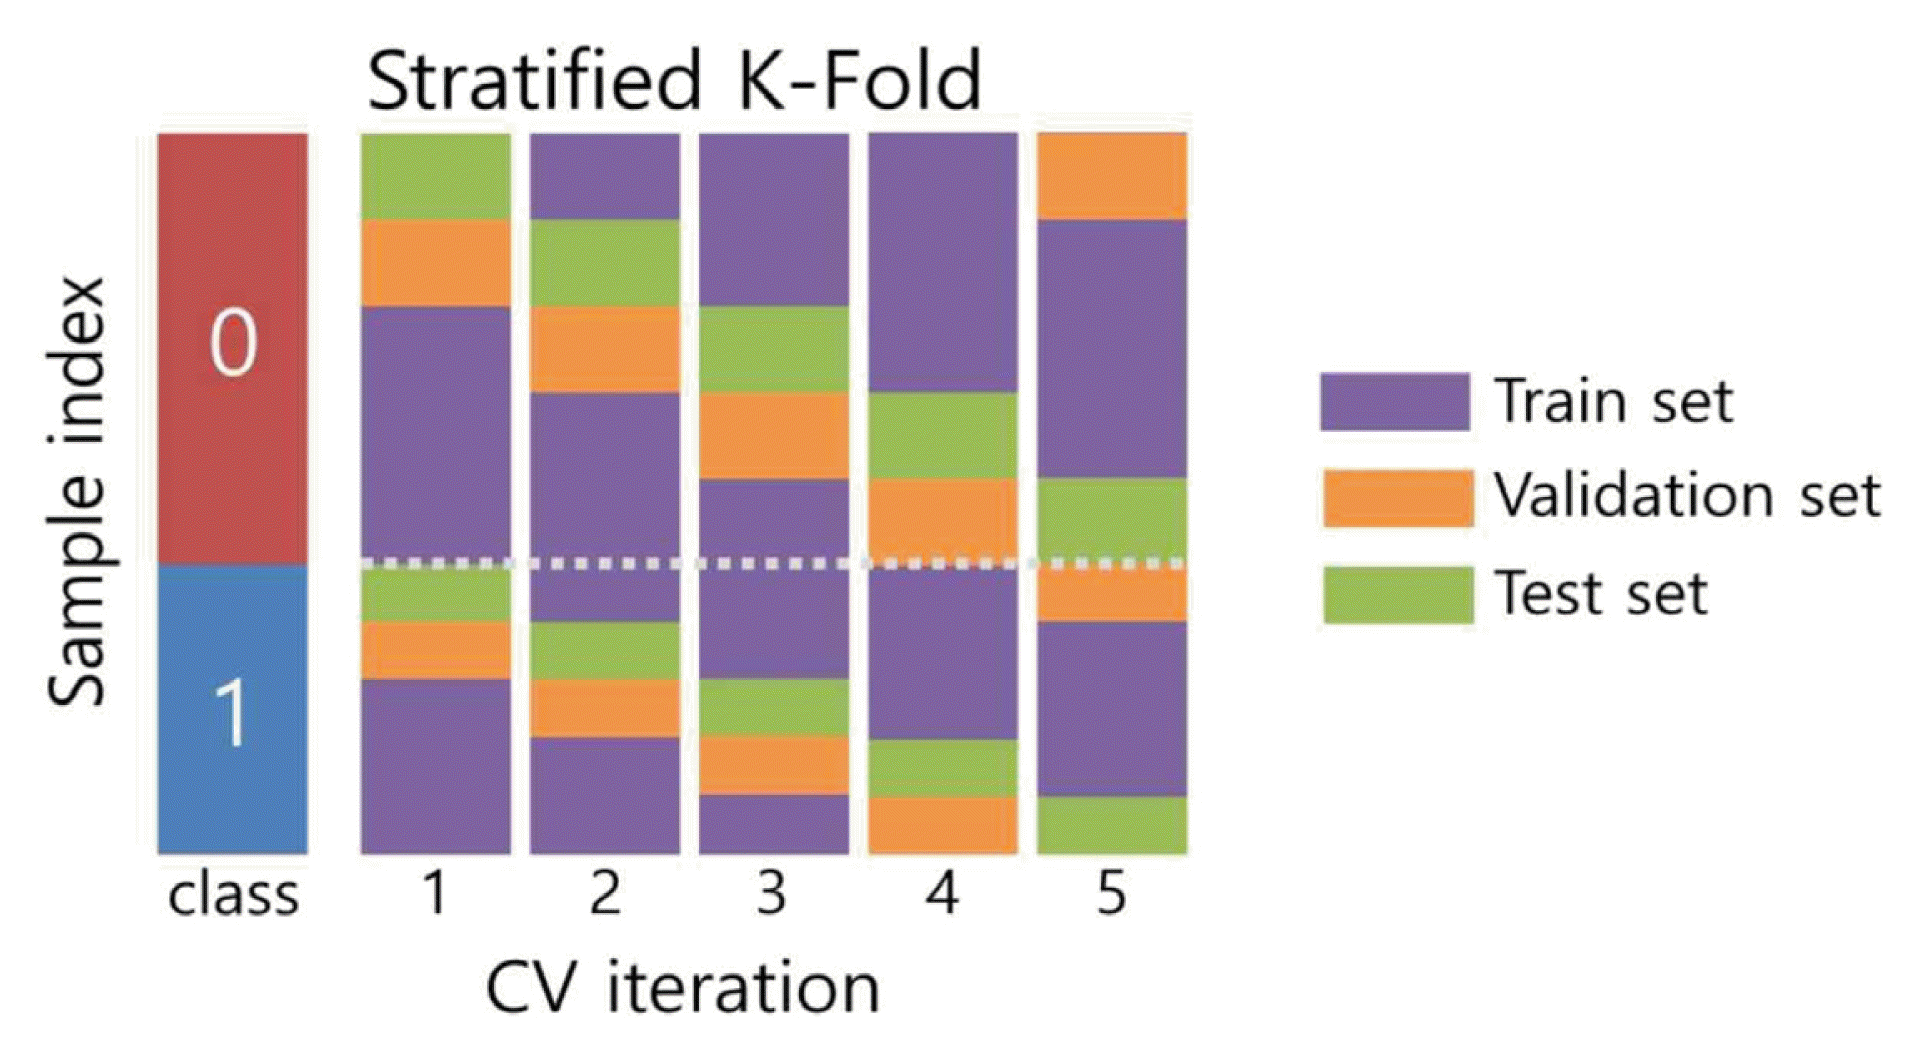
Splitting train/validation/test set using stratified k-fold
Table 2 shows the 1st and 3rd quartiles of CPS for all subjects, male, and female. The number and proportion of subjects in the group whose CPS is equal to or smaller than the first quartile (low CPS group or cold non-sensitive group) and the group whose CPS is equal to or larger than the third quartile (high CPS group or cold non-sensitive group) are shown as well in Table 2.
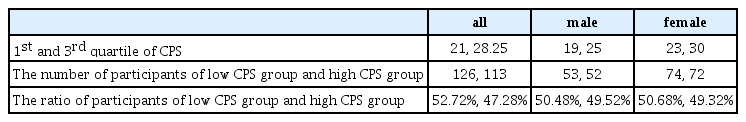
The number and ratio of participants of low CPS group and high CPS group
Table 3 shows the demographic characteristics of the low CPS group and the high CPS group, and additionally shows characteristics of two groups by sex.
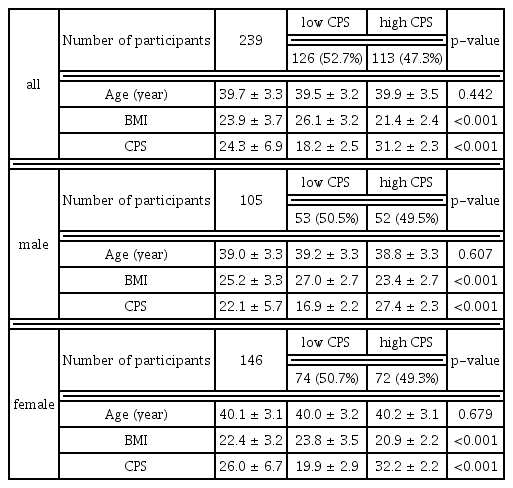
Characteristics of Low CPS Group and High CPS Group
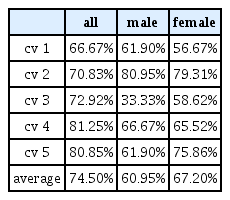
Table 4 shows the classification results for the low CPS group and high CPS group on original image via cross validation. The classification accuracy was 74.50% for both male and female, with 67.20% for female and 60.95% for male. Female showed higher classification accuracy than male.
Classification Result (Accuracy) for Original Image
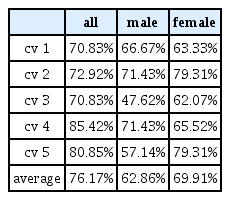
Table 5 shows the classification results for the low CPS group and high CPS group for TTA images. It was 76.17% for both men and women, 69.91% for women, and 62.86% for men. It was found that the results of the TTA image were about 1.6 to 2.7% higher than the results of the original image.
Classification Result (Accuracy) for TTA Image
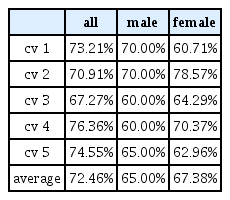
As mentioned earlier, the cold pattern questionnaire consists of 8 items, one of which asks about the degree of paleness of the face (pale face). Since the purpose of this study is to classify cold sensitivity using only facial images, it is necessary to test whether cold sensitivity can be classified using the cold sensitivity questionnaire excluding the pale face item. Table 6 shows the results of classifying the low CPS group and high CPS group when the pale face item was excluded. The classification result was 72.46% for all subjects, and 65% and 67.38% for men and women, respectively. Compared to when the pale face item was included, the classification rate decreased by 2.04% for all subjects, increased by 4.05% in male, and increased by 0.18% in female. This result shows that the presence or absence of the pale face questionnaire item does not make a significant difference to the classification results.
Classification Result (Accuracy) of Low CPS and High CPS for Original Image When ‘Pale Face’ Item Was Excluded from the Cold Pattern Questionnaire
Discussion
In this study, binary classification based on convolutional neural network (CNN) was performed to classify the cold non-sensitive group (low CPS) and the cold sensitive group (high CPS) using only face images. It showed a classification accuracy of 76.17% for all subjects, with an accuracy of 69.91% for female and 62.86% for male. The fact that the classification accuracy of subjects divided by sex is lower than that of all subjects is presumed to be because the CNN learned difference features according to sex. As can be seen in Figure 5 and Figure 7, the proportion of males was high in the low CPS group, and the proportion of females was high in the high CPS group, so it seems that difference features based on sex were learned rather than learning difference features based on cold sensitivity. To exclude this problem, the subjects were classified by sex. With a classification rate of 62.86% in male, it is difficult to be certain that cold sensitivity can be classified using only facial images. However, the classification rate of 69.91% in women is considered to be possible to some extent.
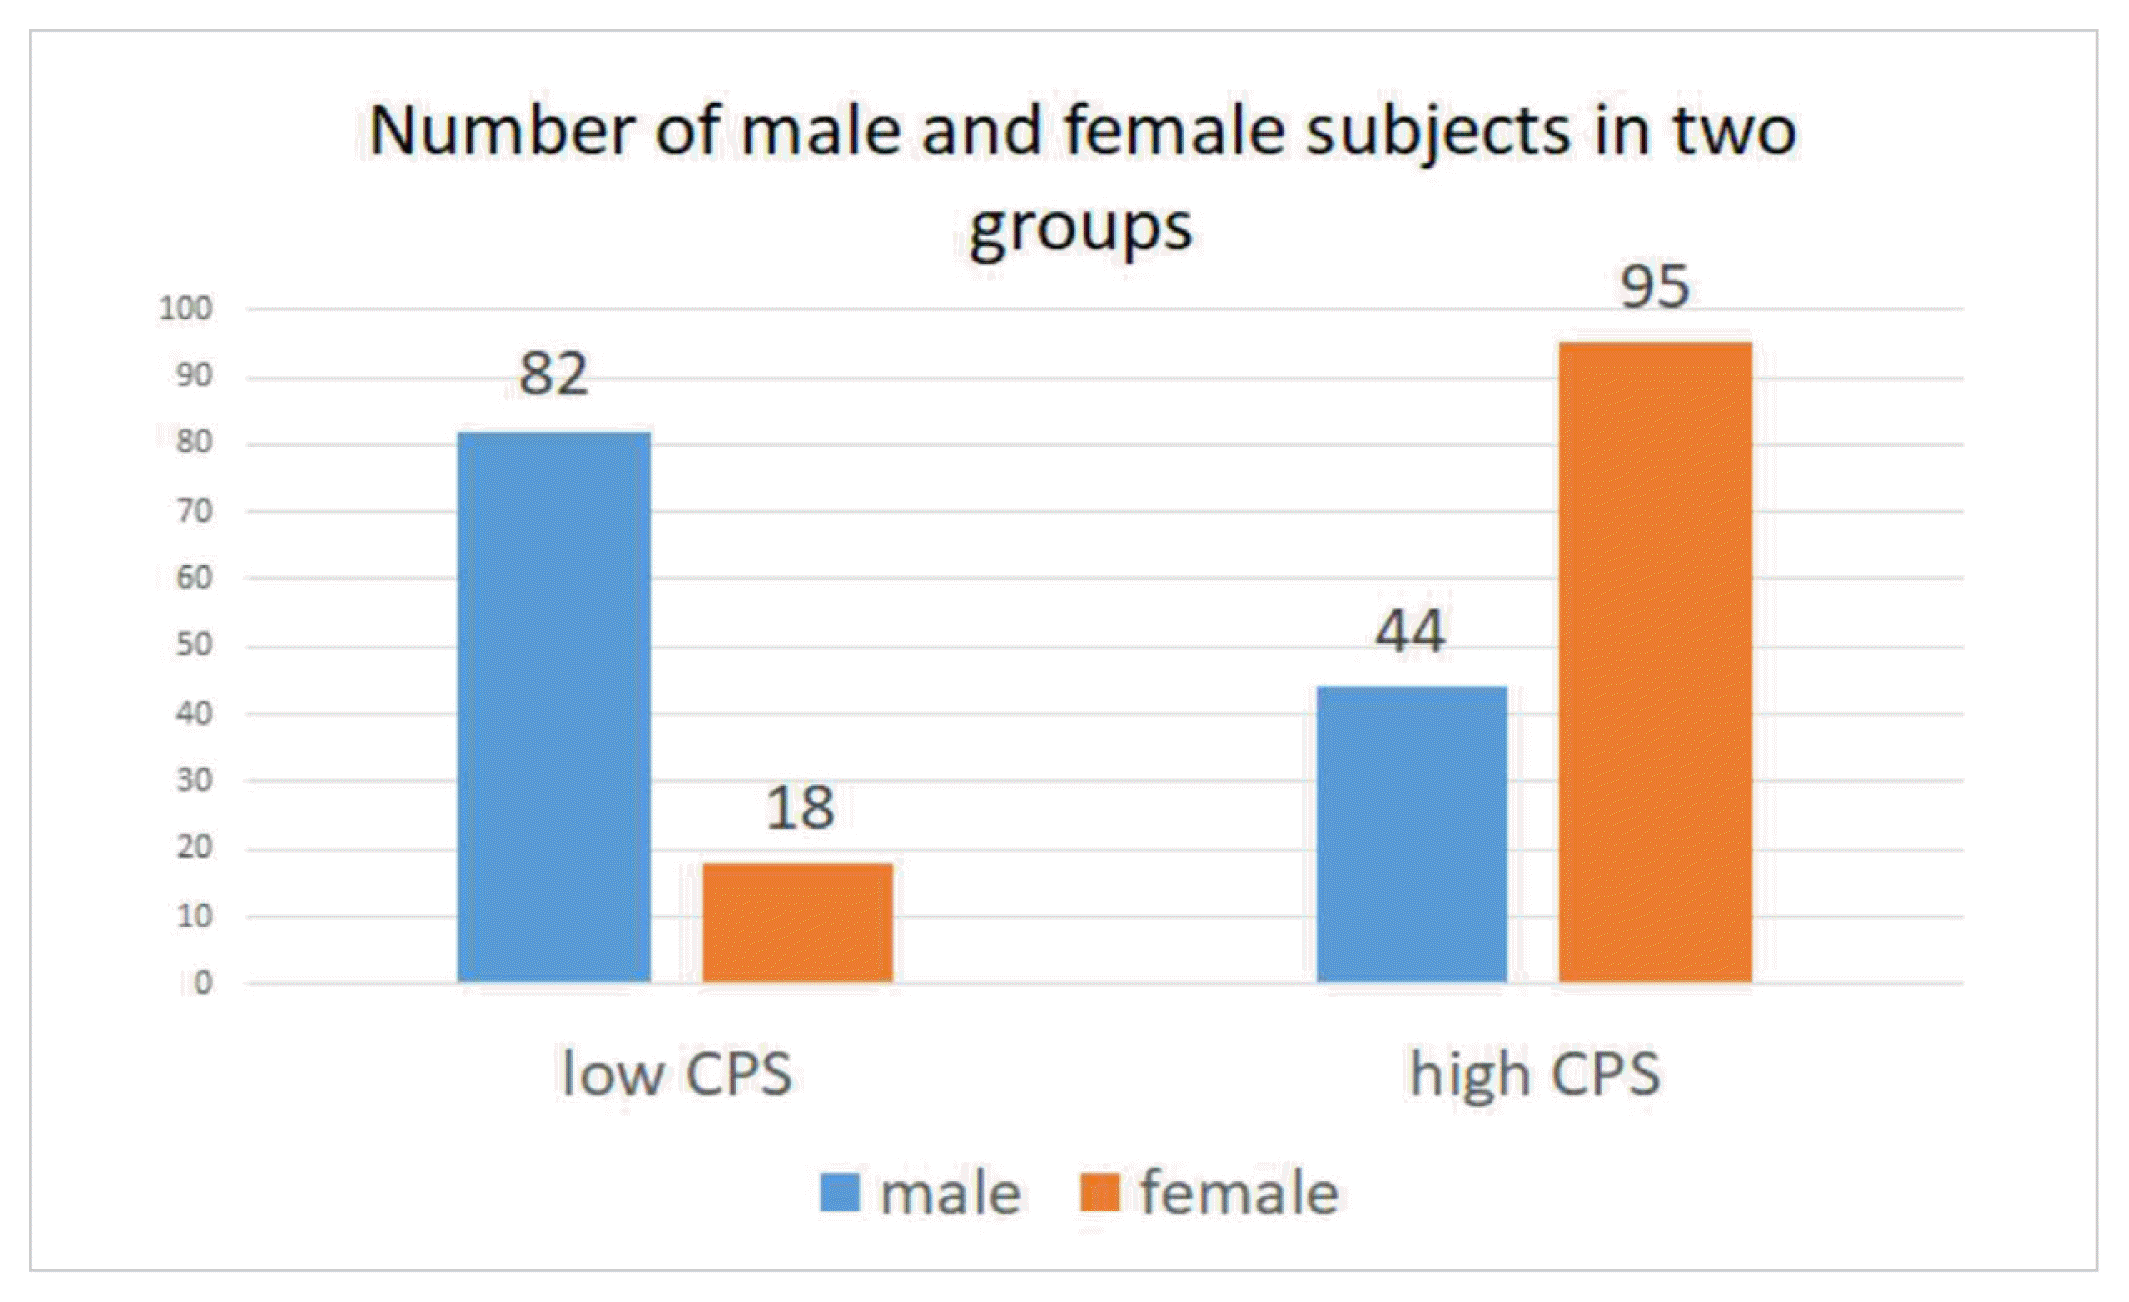
Number of male and female subjects in the low CPS group and high CPS group
Deep learning is an excellent system that produces performance similar to human recognition performance, but it is difficult to determine by what method and on what basis such results were achieved33). Classification using machine learning, which was frequently used before the advent of deep learning, was a system in which the system designer selected which features were useful for classification and classified them with a classifier using the selected features. Therefore, it was easy to identify which features were useful for classification in machine learning. However, deep learning is an end-to-end system in which a neural network extracts features appropriate for classification and performs classification all at once. Therefore, it is difficult to determine which features were extracted for classification.
In general, features that can be extracted from images include color, shape, and texture28). Among these features, the features used in existing cold pattern classification or analysis studies are facial color23) and facial shape24). In the experiments conducted in this paper, additional research is needed to determine whether color and shape are more useful features for cold pattern classification than texture. Figure 8 shows the average facial shapes of the low CPS group and the high CPS group. The facial outlines of the two groups are slightly different, and the most notable difference is that the outer outline of the high CPS group is smaller than that of the low CPS group and the chin is narrower. However, this alone cannot determine that facial shape is a more important feature than facial color.
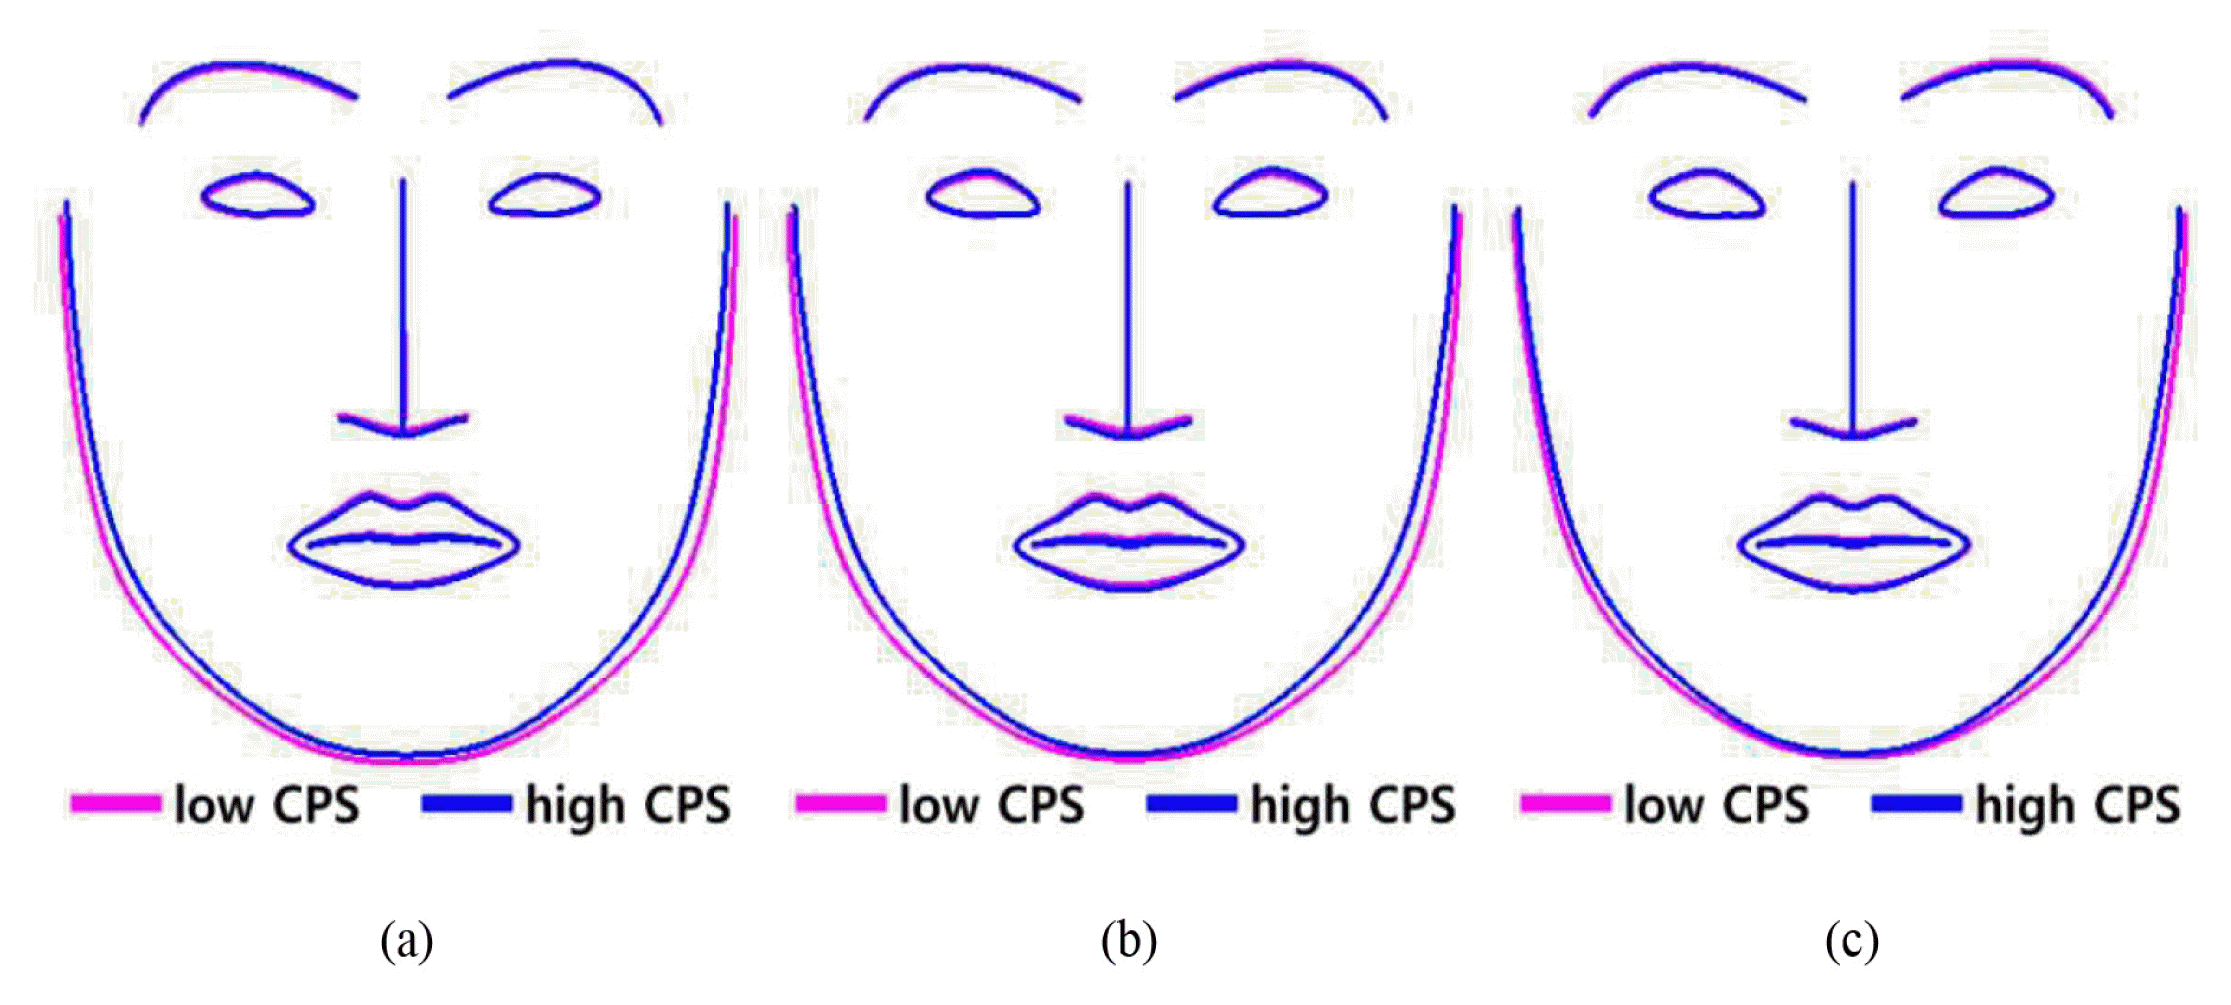
Comparison of average facial contours between the low CPS group and the high CPS group. (a) all participants (b) male participants (c) female participants
This study is significant in that it is the first study to apply the convolutional neural network (CNN), which has recently shown excellent performance, to cold pattern classification by applying it to facial images.
This study has limitations. First, due to the small number of subjects, it is unclear whether the proposed model can be generalized to other subjects. To confirm the generalizability of our findings, a larger number of subjects and subjects of different age groups are needed. Second, the classification accuracy in women showed that there was a possibility of classifying cold patterns using only facial images, but this was not the case in men. Additional research is needed to determine whether the cause is the small number of subjects or other reasons.
Conclusions
In this study, a fully automated facial image analysis system was used to classify the cold sensitive group (high CPS group) and the cold non-sensitive group (low CPS group). The classification accuracy of the cold sensitive group and cold non-sensitive group on all subjects was 76.17%, 69.91% for female, and 62.86% for male. These results suggest that it is feasible to perform facial diagnosis objectively in women to identify cold patterns. To the best of our knowledge, this study is the first to classify the cold sensitive group and cold non-sensitive group from facial images using CNN. and this study suggests that facial image analysis is of some use in classifying cold patterns.
Acknowledgements
This work was supported by the “Development of Korean Medicine Original Technology for Preventive Treatment Based on Integrative Big Data” grant from the Korea Institute of Oriental Medicine (KSN1731121).